
Let's look at it in more detail
1.) New and existing home sales have steadily decreased over the last (roughly) year and a half.
2.) Building permits started to drop at the beginning of 2006 as well.
3.) Year over year home price appreciation has fallen into negative territory.
Here's how the Dallas Fed sums up the graphs:
Today, signs of a housing market slowdown are unmistakable. New and existing home sales have been declining since mid-2005, although they remain high by historical standards (Chart 1A). Building activity has begun to cool a bit, while single-family housing permits have fallen 34 percent from their peak, settling back to pre-2002 levels (Chart 1B). The building permits data suggest further declines in single-family construction are likely, given the usual six to eight months it takes to complete a home.
Housing prices are rising more slowly—perhaps even beginning to decline outright. In the second quarter, the Office of Federal Housing Enterprise Oversight’s measure of home price appreciation registered its biggest year-over-year slowdown since recordkeeping began in 1975. Even so, home-price gains remain solidly positive at 10.1 percent by this measure, which partly controls for changes in home quality by tracking only prices from repeat sales (Chart 1C).
Let's look at two charts from the WSJ courtesy of the Big Picture Blog:

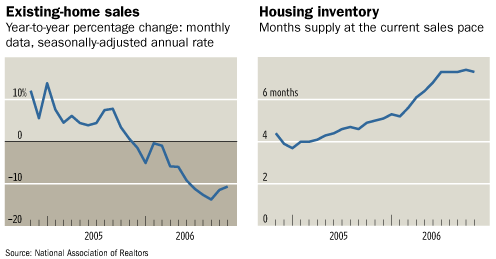
Sales are down and inventory is up. Simple econ 101: increased supply = lower price. Decreased demand = lower price. Put the two together = lower price.
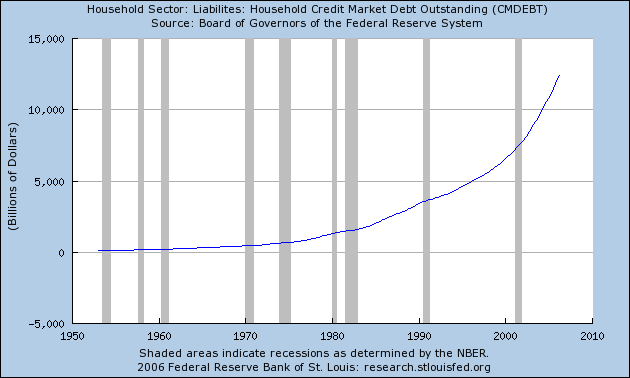
Now -- can people afford any more mortgage debt right now? Probably not. Total household debt is at record levels:

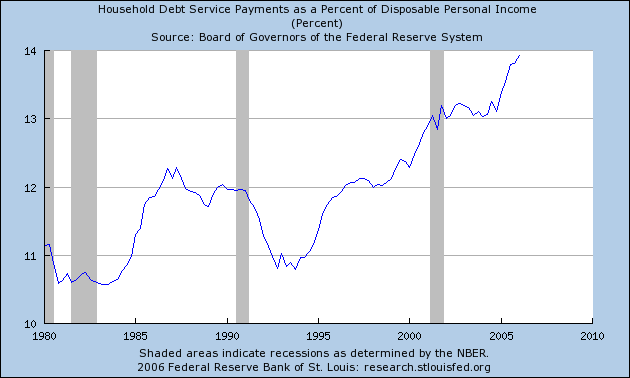
And the financial obligation ratio is also at record levels:

What does this mean for the economy?
Lower equity withdrawals:

And Lower consumption expenditures:

As the Dallas Fed notes:
The limited U.S. econometric evidence indicates that the strong pace of MEW may have boosted annual consumption growth by 1 to 3 percentage points in the first half of the present decade.[8] This implies that a slowing of home-price appreciation into the low single digits might shave 1 to 2 percentage points off consumption growth and 0.75 to 1.5 percentage points from GDP growth for a few years.
While these estimates provide an idea of housing’s potential economic impact, considerable uncertainty exists about how much a slowdown in MEW might restrain consumption growth. Key issues include how much home-price appreciation might slow, how much the deceleration would affect MEW and how much a slowdown in MEW would restrain consumer spending.


5 comments:
This trend is just too strong to turn, even if the economy remains out of recession ... indeed, the most plausible scenario seems to me to be a heavy slowdown in activity this year with a continued stagnation of prices (2007), and a price slide next year (2008). On that "strong price correction" scenario (and bearing in mind that movements that can take a week to play out in a financial asset market can take quarters to play out in a residential housing market), we could be in a position for a recovery in 2009 if the rest of the economy is able to help launch it
Thus, whether or not the economy slides into recession depends entirely on whether a new growth driver emerges to take the place of residential construction. One possible source is "forced government deficit spending", based on the fact that the cupboard is bare for the reserve stocks of equipment that the armed forces are running through in the Iraq occupation, and the political "support the troops" rhetoric can easily lead to a big upsurge in equipment sales.
I don't know whether that is already happening, but it would account for the increase production but reduced employment in manufacturing ... much of that manufacturing is very capital intensive, so the "jobs per dollar spent" ratio is very low.
I would not be so bearish on housing if the latest boom was not fueled so much by speculators. If you are speculator you prices to go up every year, I don't know what percentage, I've seen 8% as the break even point for a spec. So even if prices keep going up by say 3% a year, you lose.
I've seen articles arguing this bust won't be that bad because builders did not build on spec. But the high level of cancellations shows that even if they did not know it at the time, the builders WERE building on spec with respect to 30% or more of their production; they thought they had a buyer for the home then found out otherwise.
Thanks redfish, that's a very good point. What is "dangerous" to home builder finances about building on spec is the threat of being caught with an illiquid asset when they need liquidity.
Cancelled contracts leave them in exactly the same boat. And of course, bankruptcies among home builders can cascade down, as they turn accounts receivable into bad debt for suppliers at exactly the time that they need liquidity.
Christmas creates liquidity ... which is why we have Black Octobers but not Black Decembers ... but the seasonal flow is going to be followed shortly by a seasonal ebb ... and according to the long term forecast I saw back in December, it could happen just in time for winter temperatures to get back to normal levels for early February.
... still waiting until the Jan inventory numbers come out in February ... tick, tock, tick, tock ...
This is an extremely important and timely piece for me, and it looks quite good. That is unfortunate because I really need the charts. None of them are visible, and none but the first three have proved especially easy to track. How about adding some targets to your Photobucket links? Or finding some other way to give us ready access to the supporting documents.
In sequence:
http://i17.photobucket.com/albums/b84/bonddad/Jan6DallasFedHousing.gif
http://i17.photobucket.com/albums/b84/bonddad/20061228_sales_inventory.png
http://i17.photobucket.com/albums/b84/bonddad/hhdebt.png
http://i17.photobucket.com/albums/b84/bonddad/debtservicepaymentsasapercentofdisi.png
http://i17.photobucket.com/albums/b84/bonddad/jan6MEwandHouseprice.gif
http://i17.photobucket.com/albums/b84/bonddad/GDPandConsumption.gif
Post a Comment