First, let's get a look at the bigger picture to see what the long-term trend is. Here's a weekly chart from stockcharts:
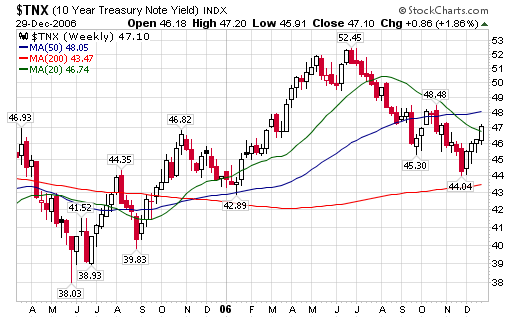
The chart is very straight-forward. The 10-year treasury had a year-long sell off starting in late June of 2005 until June of 2006. Interest rates rose from 3.98% to 5.25%, or about 125 basis points. Starting in early July of this year, interest rates reversed trending down to about 4.40%, or losing about 85 basis points.
So we have two trends:
1.) A year long Treasury market sell-off from June 2005 to July 2006.
2.) Starting in early July 2006 the Treasury market rallied, lowering interest rates 85 basis points.
We have one current mini-trend from 4.40% to about 4.70%. This is probably a year-end, profit-taking sell-off.
Let's look at a daily chart of the 10-year:
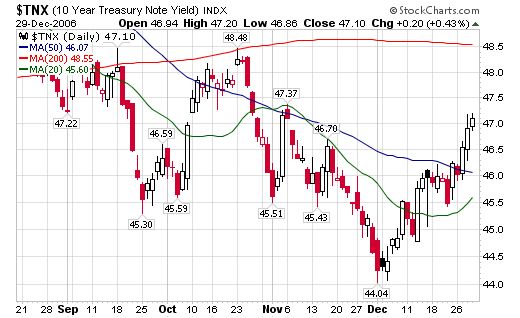
Note that in early October we had interest rates of 4.55% to 4.65%. We also had low rates for the last week of the month, but bonds sold off in mid-October to reach of high of 4.84%.
November 2006 saw a consolidation in the form of a triangle trading pattern, followed by a two-week decrease in rates to 4.40%.
So -- why this in-depth look at October and November? This is when we started to hear talk of housing "stabilizing". We also started to see some surprises in the new and existing home sales numbers.That means the interest rate during these months is very important for possible future housing market activity.
Simply eyeballing the chart, it looks as though the mean and median interest rate yield in October and November is between 4.55% to 4.65% (I could be wrong here, but remember I said "eyeballing"). That means that interest rates around this level are slightly stimulative to house buying in the current economic environment.
However, in October, rates of 4.84% were not constrictive. They weren't very stimulative either, but they didn't cause a contraction in the housing market either.
So, in the current market it looks as though interest rates below 4.84% help to at least stabilize the housing market.
Finally -- look at the long-term weekly chart again. Note that yields are at the upper-range of a downward sloping decline in prices. A solid break above say 4.75% to 4.80% could indicate the beginning of a new 10-year yield trend, with interest rates heading higher.
As with all technical analysis -- remember this is not a definitive reading of the chart because there is no definitive reading of the chart. All perception is relative and can change at a moments notice. In other words, the market will do everything in its power to humble you. And the market has a hell of a lot of power.