Friday, December 9, 2022

November producer prices: YoY measures mask recent sharp deceleration to mainly tolerable levels


 - by New Deal democrat

Consumer prices for November won’t be reported until next Tuesday, but this morning we got the upstream producer prices. The news was mainly good, although not good enough to likely dissuade the Fed from its current course of interest rate hikes.


This is one of those cases where YoY measures give a false picture in comparison with seasonally adjusted monthly data.

YoY producer price growth decelerated, but is still very high: final demand prices increased 7.4%, “core” final demand less food and energy increased 8.1%, and commodity prices are up 8.2%:


That’s down from their respective peaks, but still very high compared with the last 40 years pre-pandemic.

But now let’s look at the seasonally adjusted monthly changes:


Since June there’s been a marked deceleration in final demand prices, and an outright decline in commodity prices.

So let’s norm June to 100, and see what we get:


Final demand prices are only up 0.4% in 5 months; less food and energy up 1.4%; and commodities are down -6.1%. Onan annualized basis, the first measure is trending at 1.0% rate, while the “core” second measure is slightly problematic, increasing at a 3.4% annualized rate.

A similar pattern appears when we break final demand down into goods vs. services. While YoY goods prices are up 9.6% and services prices up 5.9%:
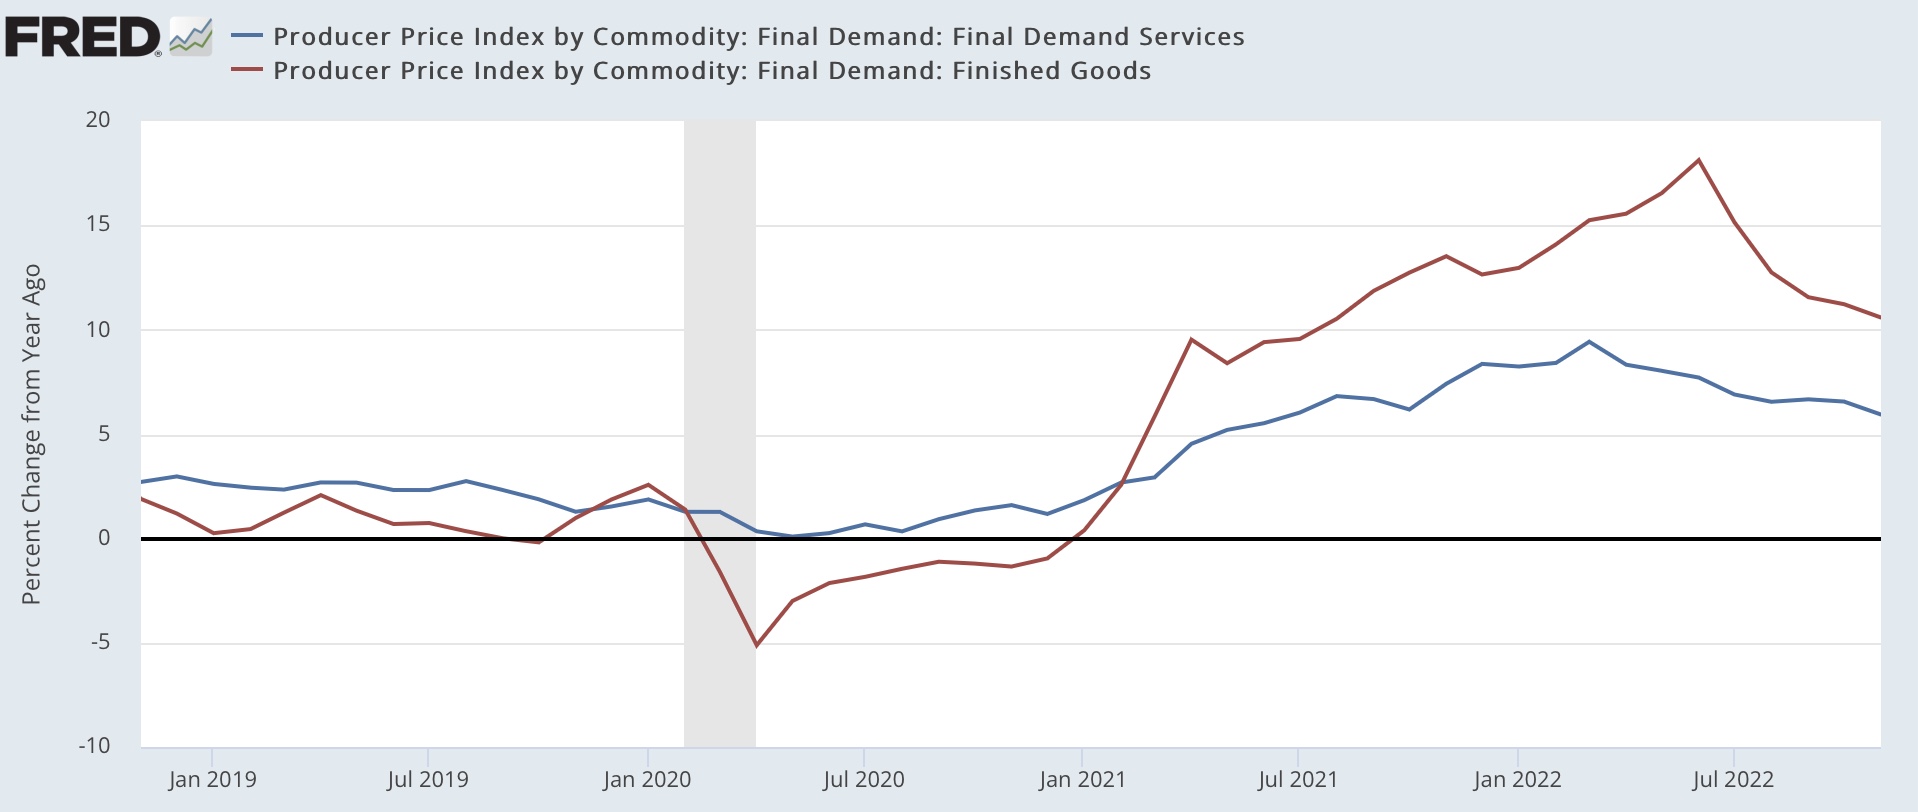


Final good services prices are up 1.5% in the past 5 months, while final demand goods prices are actually down -1.3%:


In short, most of the upstream inflation problem in producer prices has been abating rapidly. Only “core” services prices remain elevated above levels tolerated without alarm before the pandemic.

Thursday, December 8, 2022

Jobless claims: troublesome trend continues, but no yellow flag yet


 - by New Deal democrat

Initial jobless claims is one of the few remaining positive short leading indicators. But as I’ve noted for the past several weeks, the trend is troublesome.

This week initial claims rose 4,000 to 230,000, and the 4 week moving average rose 1,000, also to 230,000. Continuing claims one week previous rose 62,000 to 1.671 million:


Initial claims aren’t even as high as they were in August, but the less volatile (and less leading) continuing claims rose to the highest level since February.

If their current trend continues, all 3 could be higher YoY within two weeks.


Back in 2019, surveying the entire history of claims, I wrote that

Initial jobless claims are an important short leading indicator, typically turning up 3-9 months before a recession. A problem is the necessity of filtering out signal from noise.There are two ways I measure claims in order to do so: (1) how much has the less noisy four week average risen from its low? And (2) have initial claims, averaged monthly, turned higher YoY?

“Let’s start with the first measure. A 10% increase off of an interim low in claims is not unusual, and has happened every year or two for the entire 50+ year period that records have been kept. By the time they are up 15% from their bottom, not only is it almost always a signal of recession, but frequently the recession is imminent.
“….
“ In any given expansion, there is usually at least one month where claims are higher YoY. But if that happens for two months in a row, more often than not it has signaled that a recession is approaching.”

Last week I wrote something similar:

“In the past, if the 4 week average has been more than 5% higher YoY for any significant period of time, and less reliably, if the slightly lagging continuing claims were higher YoY, a recession was almost always close at hand.”

Here’s what the YoY% change in both the 4 week average and continuing claims look like historically:


At 230,000, the. 4 week average of initial claims is 35% higher than its low of 170,500 set in April. But they are still -5.8% lower YoY, and continuing claims are -20.4% lower YoY:


As I wrote above, if the current trend continues, that could change before the end of this month, warranting a yellow caution flag. But because the series is sufficiently noisy, even then I would want to see several months of ongoing weakness before hoisting any red flag, and even the note the false positives at least once during each decade between 1970 and 2010.

Wednesday, December 7, 2022

Coronavirus dashboard for December 7: the first winter wave of endemicity begins


 - by New Deal democrat


COVID is well on its way to becoming endemic, with a significant background level similar to what we have experienced in the last 8 months, and a surge during the winter months when people spend more time socializing together indoors.

In that vein, it is apparent that, as expected, Thanksgiving get-togethers have triggered a new wave of COVID infections.

Wastewater measures from Biobot show an apparent start to an exponential rise:


This is true not just nationally but in every Census region, especially the Northeast (yellow in the graph below) but the West (green), where the increase is slower:


The data is consistent with close to 400,000 “real” daily cases.

Confirmed cases have also increased from about 37,000 before Thanksgiving to 55,800 (although some of that is a data dump from New Jersey). Deaths still remain very low at 322:


And hospitalizations have increased from 24,000 in mid-November to 34,600, 6,000 of which is just in the past 7 days:


More holiday get-togethers will only make this incipient winter wave worse.

Unfortunately, part of this is the very poor uptake of the new bivalent booster shot. Per Dr. Eric Topol, “Only 1 in 3 American seniors have been boosted in [the past] 6 months.”

Hospitalizations for seniors, at least in some States, are higher than they have been since the original Omicron wave one year ago:


This is particularly exasperating, since the CDC just updated their data showing that being fully boosted lowers seniors’ risk of hospitalization by 80%:


Although mitigation efforts like masking have all but evaporated, my template is that this wave will likely be similar to the BA.1.12.1 and BA.5 waves earlier this year, both of which peaked at roughly 125,000 confirmed cases and 500 deaths per day. This peak will probably be in about mid-January.


Tuesday, December 6, 2022

Scenes from the November employment report: the short leading jobs indicators


 - by New Deal democrat

Every month as part of my post on the jobs report, I run through the changes in those measures which are short leading indicators for the economy.


There were some significant developments in the past several months, so let’s take a closer look here.

Here’s a historical look at temporary help services, residential construction jobs, and total construction:


The first two typically turn down months before employment as a whole, and the last one at least turns flat.

Now here’s the close-up:


Temporary help didn’t just turn down in November, but several previous months were revised down as well (h/t Bob Dieli). Residential construction jobs turned down, and have been generally flat for half a year. Only total construction jobs are still increasing.

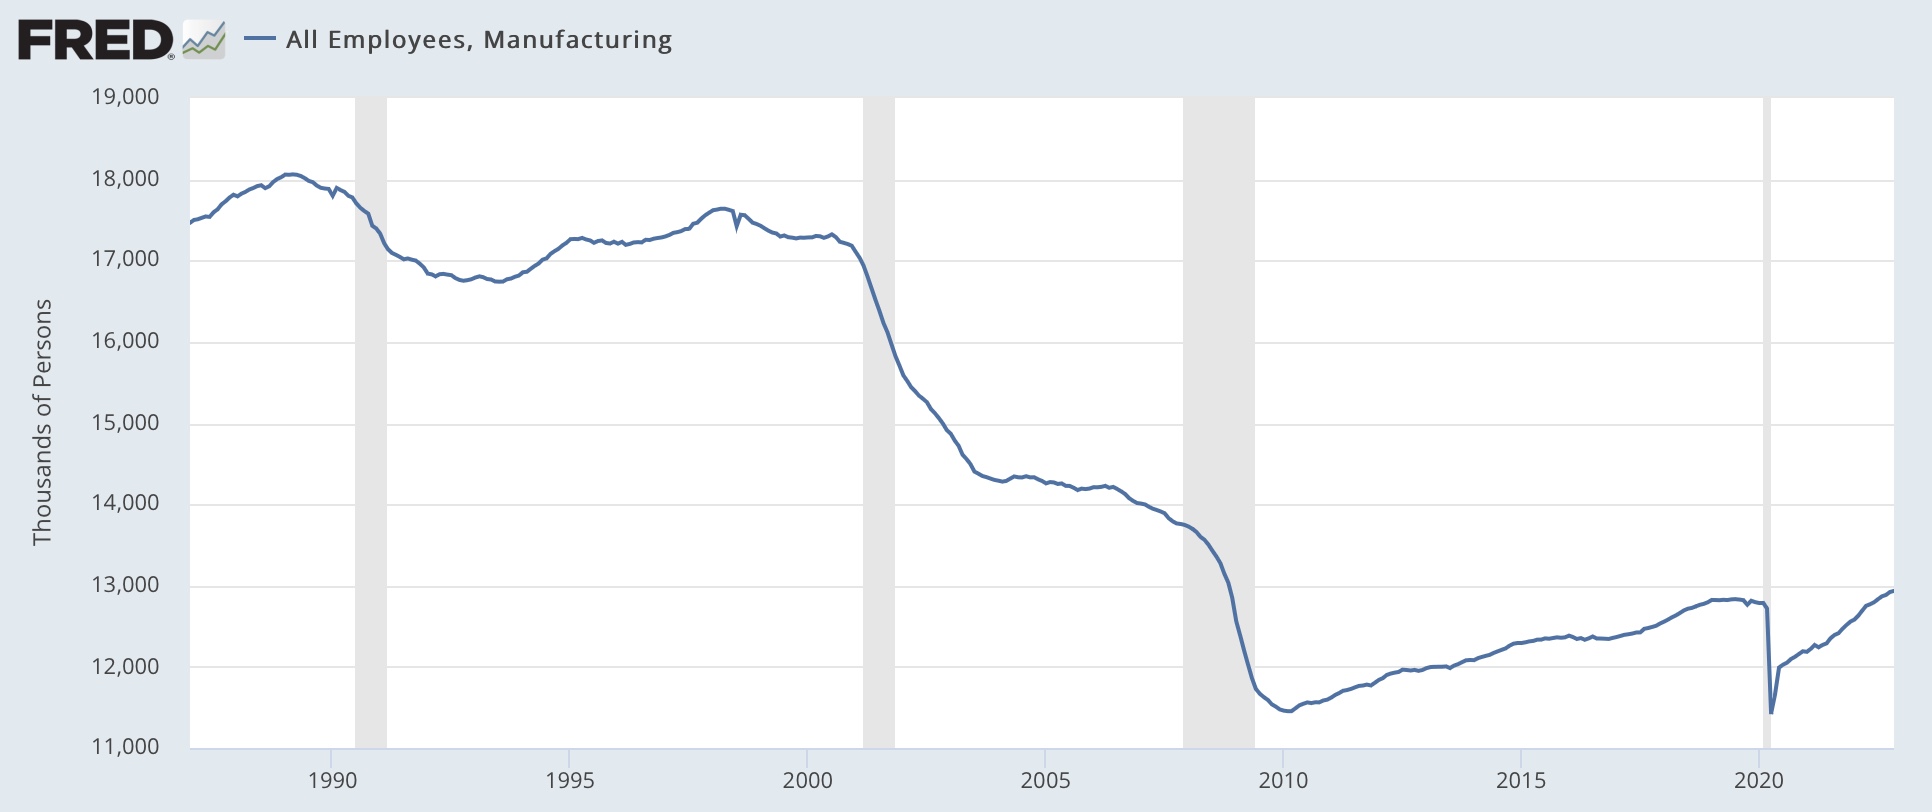
Manufacturing jobs also typically turn down before a recession:


These have continued to increase through November (pretty surprising given the weak Fed new orders and ISM manufacturing reports).

But manufacturing *hours* are much a more sensitive indicator than manufacturing jobs (shown YoY for better comparative purposes):


And manufacturing hours YoY are down by a % typically associated with previous recessions.

In the past, a decline of -0.6 hours from the expansion peak has been the average consistent with the onset of a recession, and that is what we have now:


Finally, in a manner similar to initial jobless claims, the number of those unemployed for less than 5 weeks has typically risen before the onset of a recession (very noisy, but true even for the smoother 3 month rolling average):


Here is the close-up of that metric for the past year:


In short, most of the leading indicators of a jobs recession are either signaling an oncoming recession now (temporary jobs, manufacturing hours, short term unemployment) or at very least are close (residential construction). Only total manufacturing and construction jobs are still increasing.

I expect both manufacturing and construction jobs to turn down in the next few months as well, given the poor ISM manufacturing index, and the likelihood that housing units under construction will turn down significantly.

Monday, December 5, 2022

New factory orders remain an economic bright spot


 - by New Deal democrat

New factory orders for October were reported this morning. I normally don’t write about them, because they are very noisy, but since at the moment they are one of the few bright spots among the short leading indicators, let’s take a look.


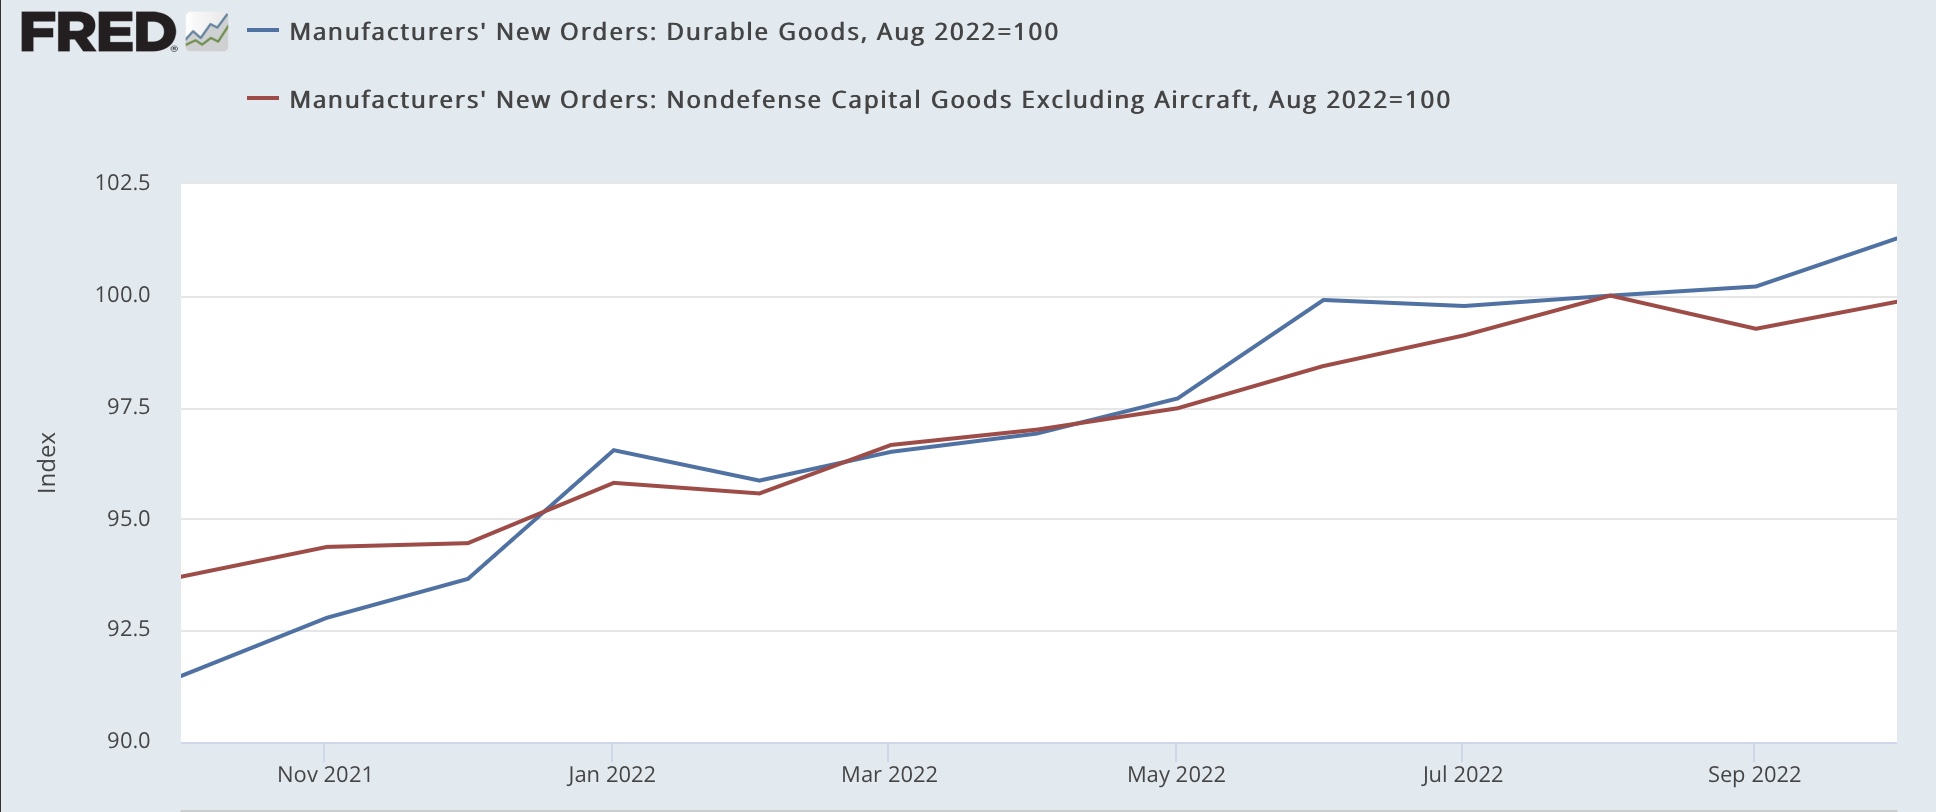
Total new factory orders rose 1.0%. “Core” orders excluding defense and aircraft rose 0.6%:


“Core” orders have been flat for 2 months, which may or may not portend a turning, but as you can see from the below longer term view, typically factory orders turn down or at least flatten in the months before a recession - although it’s frequently only apparent in retrospect:


Consumer durable goods orders are also a short leading indicator. They were unchanged for the month:


With other measures of manufacturing from the regional Feds and ISM showing pronounced weakness, it’s a little surprising that it hasn’t shown up here.

Anyway, in the interest of balance, there are still some bright spots.


Saturday, December 3, 2022

Weekly Indicators for November 28 - December 2 at Seeking Alpha


 - by New Deal democrat

My Weekly Indicators post is up at Seeking Alpha.

First the long leading indicators turned. Then the short leading indicators turned. Now the coincident indicators are weakening to new expansion lows almost every week.

The silver lining is: the first long leading indicator may already have hit its worst levels.

As usual, clicking over and reading will bring you up to the virtual moment as to the economy, and reward me a little bit for my efforts.

Friday, December 2, 2022

November jobs report: decidedly mixed signals, most consistent with a still-growing but decidedly weakening economy


 - by New Deal democrat


Since early this year I have expected employment to follow the halt in consumption growth, decelerating over time to a stall. This has only intensified given the major decline in growth in payroll withholding tax payments, which are near recessionary. 

This expectation was partially met today in that the three month average in employment gains since February, which had decelerated from over 500,000 to 289,000 through October, decelerated further to 272,000 through November.

Aggregate payroll growth also declined YoY from 9.1% to 8.7%, but is still probably above the inflation rate.

Here’s my in depth synopsis.

HEADLINES:
  • 263,000 jobs added. Private sector jobs increased 221,000. Government jobs increased by 42,000. 
  • The alternate, and more volatile measure in the household report *delined* for the second month in a row, by -133,000 jobs. In the past 8 months, according to this report, only 12,000 jobs have been added! The above household number factors into the unemployment and underemployment rates below.
  • U3 unemployment rate was unchanged at 3.7%.
  • U6 underemployment rate fell -0.1% to 6.7%.
  • Those not in the labor force at all, but who want a job now, rose 167,000 to 5.550 million, compared with 4.996 million in February 2020.
  • Those on temporary layoff declined -44,000 to 803,000.
  • Permanent job losers rose 127,000 to 1,368,000.
  • September was revised downward by -46,000, while October was revised upward by 23,000, for a net decrease of 23,000 jobs compared with previous reports.
Leading employment indicators of a slowdown or recession

These are leading sectors for the economy overall, and will help us gauge whether the strong rebound from the pandemic will continue.  These tilted to the negative:
  • the average manufacturing workweek, one of the 10 components of the Index of Leading Indicators, was declined -0.1 hour to 40.9, and is down -0.7 hours from its recent February peak of 41.6 hours. This is consistent with the onset of a recession.
  • Manufacturing jobs increased 14,000, and are at a level higher than before the pandemic.
  • Construction jobs increased 20,000, also at a level higher than before the pandemic. 
  • Residential construction jobs, which are even more leading, declined by -2,600.
  • Temporary jobs, which had been rising sharply, declined  by 17,200. Since the beginning of the pandemic, about 300,000 such jobs have been gained.
  • the number of people unemployed for 5 weeks or less increased by 32,000 to 2,243,000, about 125,000 above its pre-pandemic level.

Wages of non-managerial workers
  • Average Hourly Earnings for Production and Nonsupervisory Personnel rose $0.19 to $28.10, which is a 5.8% YoY gain, an increase of 0.3% from last month, vs. its 6.7% peak at the beginning of this year.

Aggregate hours and wages: 
  • the index of aggregate hours worked for non-managerial workers declined -0.2% which is still above its level just before the pandemic.
  •  the index of aggregate payrolls for non-managerial workers rose by 0.6%, and is up 8.7% YoY. This metric has been decelerating nominally almost consistently for the past 16 months.  Compared with inflation through October, it is up only 0.9% YoY (recessions typically start when it crosses zero).

Other significant data:
  • Leisure and hospitality jobs, which were the most hard-hit during the pandemic, rose 88,000, but are still about -6% below their pre-pandemic peak.
  • Within the leisure and hospitality sector, food and drink establishments added 62,100 jobs, but are still about -4% below their pre-pandemic peak. 
  • Professional and business employment increased by only 1,000, over 1,000,000 above its pre-pandemic peak.
  • Full time jobs increased 92,,000 in the household report.
  • Part time jobs decreased -302,000 in the household report.
  • The number of job holders who were part time for economic reasons rose 25,000 to 3,685,000.
  • The Labor Force Participation Rate declined -0.1% to 62.1%, vs. 63.4% in February 2020.

SUMMARY

This report was mixed, with both strong and decidedly weak points. On the strong side, wages increased sharply, improving the YoY gains as well. The underemployment rate fell. Construction and manufacturing jobs increased. YoY aggregate payrolls decelerated further, but probably improved vs. YoY inflation. While the 3 month average gain in payrolls continued to decline, in absolute terms it remains good.

On the negative side, the manufacturing workweek has declined enough to be consistent with the onset of recession. Temporary and residential construction jobs declined. The number of short-term newly unemployed rose. All of these are leading indicators, and suggest further weakness to come. Aggregate hours worked declined, and are only up 1.3% in the past 9 months. Perhaps worse, employment as measured by the household report is only up 12,000 in total for the entire last 8 months, which is very much in line with the weak tax withholding data. In other words, I increasingly expect significant downward revisions to the recent establishment reports when they are revised next year.

This mixed report, taken all together, is most consistent with a still-growing economy, but one which is weakening, the theme for the entire last 6 months or more.


Thursday, December 1, 2022

November manufacturing and October construction both decline, the former almost at recessionary levels


 - by New Deal democrat

As usual, we begin the new month’s data with the ISM manufacturing index. This index has a very long and reliable history. Going back almost 75 years, the new orders index has always fallen below 50 within 6 months before a recession. Recessions have typically started once the overall index falls below 50, and usually below 48.


Which means that today’s report for November comes very close to meeting all of the above criteria. The overall index declined below 50 for the first time since May 2020, at 49.0. The new orders subindex declined -2 to 47.2, the 5th time in the past 6 months that it has been below 50, and only 0.1 above its September low of 47.1:


This is a reading on the very cusp of recession.

Construction spending for October was also reported, and also showed declines of -0.3% for both total and residential spending:


Total construction spending is -1.3% below its July peak, while the more leading residential construction spending is -7.1% below its early May peak.

Since construction spending is a series with only a 30 year history, there is no reliable recession marker, except that residential spending turns down in advance.

Finally, below is a comparison of total residential construction spending vs. housing units under construction from the permits and starts report:


While there is a general concordance, there is no set pattern as to which turns first or simultaneously. I continue to expect housing units under construction to follow permits and starts and turn down shortly.

In sum, our two final reports of the day show declines in both leading sectors of manufacturing and construction, the former more seriously than the latter.

Strong personal income and spending contrast with near record low in saving


 - by New Deal democrat

Like retail sales earlier in November, personal income and spending both rose smartly, as shown in the below graph of real retail sales compared with real personal spending:


Real personal income was up 0.4%, and real personal spending increased 0.5%:


Nominally each increased 0.3% more; i.e., the PCE deflator was 0.3%. Each metric only had one better reading in the entire past year.

Since the spring 2021 stimulus ended, personal spending is up 3.9%. Personal income remains down -1.9%, although it has improved in the past few months (thank you, big decline in gas prices!):


With real income still down, you may wonder where all the fuel for increased spending has been coming from. The answer is a continuing decline in the saving rate, which at 2.3% for October, was the lowest in the entire 60+ year history of the series, except of one month (July 2005), as shown in the below graph which subtracts -2.3% so that the current level shows as zero:


In short, both sales and spending - two sides of the same coin - were strong in October, assisted in part by the continuing decline in gas prices. But with near-record low savings, consumers are more vulnerable to a negative shock than they have ever been.


Initial jobless claims get closer to signaling recession


 - by New Deal democrat

Today is one of those data-palooza days, so I’ll put up separate posts on personal income and spending, and the ISM manufacturing report and construction spending reports later.


But let’s start with weekly jobless claims, and the news here is OK for the week, but the trend is troublesome.

Initial claims declined -16,000 from last week’s 3 month high to 225,000. But the 4 week average climbed 1,750 to 228,750, the highest level since January 22 of this year. Continuing claims rose 57,000 to 1.608 million, the highest since February 26:


In the absolute sense, very few people are getting laid off, and those who are still are able to find new jobs pretty quickly. But the trend is deteriorating. At its recent pace, the 4 week average of initial claims is likely to go negative YoY by the end of this month.

In the past, if the 4 week average is more than 5% higher YoY for any significant period of time, and less reliably, if the slightly lagging continuing claims are higher YoY, a recession is almost always close at hand:


The first marker could be met by January 1. The second marker could be met by February.

Since initial claims is one of the last positive short leading indicators, this is a bad sign.

Wednesday, November 30, 2022

October JOLTS report shows continued deceleration in jobs market, with continuing gap in job openings filled


 - by New Deal democrat

For the past year, I have likened the jobs market to a game of reverse musical chairs, where there are more chairs than players. Some chairs are always left empty. The chairs are jobs, and the players are job seekers. Since the lowest paying jobs have always been left empty, there is tremendous pressure to raise wages. And as job-jumping is rewarded with greater pay increases, there is *continued* inflationary pressure.


The October JOLTS report showed both deceleration, but also that the game remains intact.

Let’s begin with the long term graph of openings, hires, quits, and total separations since the beginning of the series:


A year ago hires, quits, and separations were all at their highest levels since the series began, equivalent to 2006 and 2019. Openings were sky high, 50% higher than even their best levels before the pandemic. This was simply tremendous pressure on employers to raise wages and increase benefits in order to attract job seekers - and many slots went unfilled.

Now here is a close-up of the last 2 years in the above data:


All 4 series hit their best levels in the first few months of this year, and all have deteriorated since. Hires declined 84,000 in October to their lowest level since January 2021. Quits declined 34,000 to their lowest level since May 2021. Total separations did rise 18,000 for the month, but otherwise also were at the lowest level since May 2021. 

Finally, openings declined 353,000 for the month, but remained 64,000 above August’s level. Whether the last several months indicate a pause in the downward trajectory of that metric remains to be seen, but aside from August, October was the lowest level since June 2021.

Layoffs and discharges make bottoms during expansions and increase leading into recessions. They did increase by 58,000 in October, but remained generally in line with their level for the past 18 months:


By way of contrast, during the previous two expansions, quits averaged between 1.6M-2.0M per month. During the Great Recession, they rose as high as 2.650M.

In summary, the October JOLTS report shows that while the game of musical chairs remains intact, the overall theme of deceleration has continued. Some employers may be keeping job openings up formally, but choosing not to fill them due to wage pressures or a decline in overall demand.


Tuesday, November 29, 2022

House price indexes continue to show the top is in


 - by New Deal democrat

The FHFA and Case Shiller house price indexes were reported this morning, with both continuing to show that the peak in house prices took place during the summer.

For the month, the seasonally adjusted FHFA index rose +0.1%, vs. a +0.9% increase one year ago, and following two months of -0.6% and -0.7%, respectively. The Case Shiller national index declined -0.5%, following -0.5% and -0.9% declines in the previous two months.

Here are the absolute seasonally adjusted values. The FHFA index is down -1.2%, and the Case Shiller national index is down -2.6%, respectively from their June peaks:


And here are the YoY% changes, with the FHFA up 11.0% and the Case Shiller national index up 11.2% (Note: FRED has not yet updated the Case Shiller data):


The question now is, how far down do house prices go? In the 2007-11 bust, house prices fell a little over -20%. But in the smaller 1990-91 downturn, prices only declined about -3%. 


I have seen guesstimates of a -5% to -10% decline in house prices in this downturn, and that is a reasonable first dart-throw, although my guesstimate would be at the -10% end of that range. That’s because the Fed seems hell-bent on causing a sharp recession, and that recession will bring lots of joblessness, which in turn will mean more people unable to make mortgage payments, and so suffering foreclosure.

Speaking of the Fed, here is my updated graph of the YoY% change in the FHFA index (/2) vs. Owner’s Equivalent Rent in the CPI:


For literally over a year I have been writing that the house price indexes forecast OER rising all during this year, ultimately to record YoY% increases, and peaking at perhaps 9%; dragging core consumer inflation higher with it. Three of the four forecasts have com to pass. One is pending, with the most recent OER reading up 6.9%.

The continued YoY deceleration in the house price indexes give me confidence that, after continuing to rise for a few more months, probably beginning next spring or so, monthly OER increases will begin to decline as well. 

Will the Fed take heed?

Monday, November 28, 2022

New home sales adjusted for cancellations: still signs that a bottoming process might be taking place


 - by New Deal democrat

I had a correspondent question me about whether new home sales might actually be in the process of bottoming, due to the big increase in the percentage of cancellations, as shown below (via Bill McBride):


This is something I’ve been aware of, and commented on one month ago in the context of housing that was permitted but not started.

There are two responding points to be made.

The first is that this is not the first time new home sales have turned down. There is no reason to believe that there weren’t similar increases in cancellation rates in any of the other downturns caused by increases in mortgage rates, so the pattern in new home sale was probably similar in those downturns as well:


But let’s apply the data to current new home sales. Here’s the graph of the last two years I ran last Friday:


Below I show the raw data for new home sales (annualized, in thousands) in the first column, followed by the cancellation rate for that month, and finally the net sales after adjusting for cancellations:

 Apr 619 8.0% 569
May 569 10.5% 509
Jun 571 15.2% 484
Jul 543 18.4% 443 (LOW)
Aug 566 18.3% 540
Sep 583 20.4% 468
Oct 632 25.6% 470

As indicated above, the adjusted low to date was in July. October’s rate was in line with September’s and June’s.

Of course, the series could certainly go lower in coming months.

But as I’ve indicated a number of times recently, now that an oncoming recession is virtually certain, I am beginning to look for signs in the long leading indicators of how long that recession might be. And new home sales, for all of its noise and heavy revisions, is one good place to start looking.
 

Friday, November 25, 2022

Have new home sales made a bottom?


 - by New Deal democrat

Hopefully you are recovering from your turkey coma today. Here’s a little late commentary on Wednesday’s new home sales report.


New home sales are noisy, and heavily revised, which is why I prefer housing permits, and especially single family housing permits, as a source of information.

But . . . on the other hand, new home sales tend to be the very first housing metric that turns. In fact, during expansions they often peak so early that they are more of a mid-cycle indicator than a long leading indicator. Here’s the comparison of new home sales with single family permits from the 1970s through the Great Recession:


Sometimes the two series peak and trough simultaneously, but not that often (1977, 1985, 1998, 2005) new home sales hit their peak a few months before permits.

Why is that of note? Here is the current expansion:


As per my comment above, new home sales peaked first. But also look at the far right side of the graph. New home sales bottomed in July and are currently at their level from last spring, while permits are still heading south.

Beware revisions, but new home sales may be signaling a bottom for the housing market, which might be correct if long term interest rates are in the process of peaking now, despite the Fed continuing to raise short term rates.

Median new home prices are not seasonally adjusted, so the only good way to look at them is YoY. Remembering as always that sales lead prices, here is the YoY% change in each:


Again, very noisy, but the overall YoY trend in prices is down. The 3 month average gain over the past year has declined from over 22% to under 12%, suggesting that new home prices are on the cusp of turning down in absolute terms.

On a more general note, notice that, having made a recession warning, I am now on the lookout for the indicators that will tell me how long and deep the recession might be, and when it might bottom out. Watching for a peak in long term interest rates is an important part of that process.