Tuesday, August 24, 2010

Business Investment, Consumer Spending And Current Economy

From the Washington Post:

Many Democrats say the economy needs more stimulus. Business lobbyists and their Republican allies say it needs less regulation and lower taxes.

But here in the heartland of America, senior executives say neither side's assessment fits.

They blame their profound caution on their view that U.S. consumers are destined to disappoint for many years. As a result, they say, the economy is unlikely to see the kind of almost unbroken prosperity of the quarter-century that preceded the financial crisis.

Across the industrial parks and office towers of the Chicago region, in a more than a dozen interviews, senior executives said they see Americans for years ahead paying down debts incurred during the now-ended credit boom and adjusting spending to match their often-reduced incomes.

"It's a different era," said Daryl Dulaney, chief executive of Siemens Industry, which has 30,000 U.S. employees who make lighting systems for buildings and a wide range of other products. "Our hiring and investment decisions have to be prudent and reflect that."

Executives see little evidence that the economy is slipping back into recession. But they describe a business environment in which sales come in fits and starts and their customers can't predict what they will want to buy in the future.

"In the past, our customers had more long-term vision on what they're going to need," said Bill Larsen, president of Larsen Packaging Products in Glendale Heights, Ill. Now, he said, "they don't know what they're going to need and when they're going to need it."

I think this article/perception really explains a great deal about the current economic situation. First, the latest Senior Loan Survey from the Federal Reserve noted that loan demand is still weak. As the article highlights, businesses see little need to take out loans because they see a weak economy going forward.

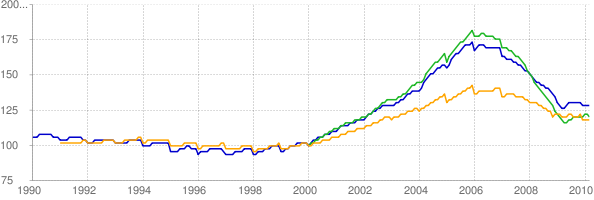
NDD hit on a big part of it yesterday -- the paying down of debt and how that is impacting growth going forward. Consider these charts from the St. Louis Federal Reserve:


First, this chart is exponential. Total consumer debt outstanding has increased at a more or less consistent rate until this recession. Now the growth has dropped a bit as households pay down their debt. This drop in debt has occurred in both mortgage and revolving credit (neither of the following charts are logarithmic to better highlight the severity of the contraction in both):


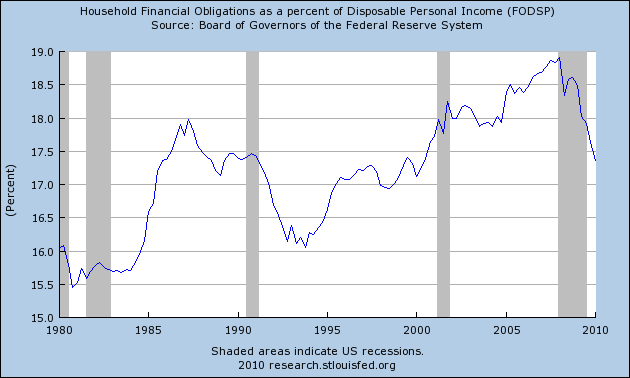
As a result of this decrease, households are under less financial stress:


It's important to note that despite the decrease in consumer debt, the economy is seeing some increase in PCEs.


Total real PCEs are clearly off their lows, although recent revisions have placed them below the peak of the last expansion.


Real spending on services has increased slightly, but is better characterized as having dropped and leveled off. These comprise about 65% of total PCEs.


Real spending on non-durables has increased from its post recession lows, as has


Spending on durable goods.

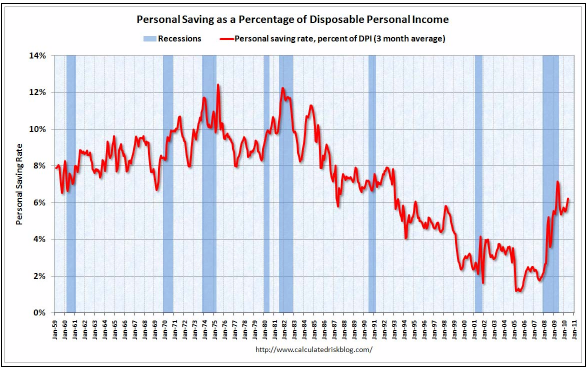
The money for this spending is coming from increased savings:


In short, the consumer is spending, just not as robustly as before. And his paying down debt is a key part of the slowdown.

No, Really, Austerity Doesn't Work

From the FT:

The eurozone’s growth spurt lost momentum this month, as an expansion in output in Germany and France failed to make up for a near standstill elsewhere in the 16-country region.

A closely followed barometer of business activity on Monday pointed to a slower but still solid expansion in private sector activity, with the region’s prospects hanging largely on Germany and France, its two largest economies.

The purchasing managers’ indices are regarded as an early indicator of business trends, and the latest readings contained some hope of growth continuing at a brisk pace, even if the US economy slows.

But they intensified worries that the region will be marred increasingly by weaker growth in the peripheral eurozone countries such as Spain and Greece, where fears remain over the stability of public finances


I realize that abject stupidity is becoming the currency of political discourse on both sides of the aisle, but really, the whole austerity thing doesn't work.

Here's a chart of the data from the same article:

Yesterday's Market


Click for a bigger chart.

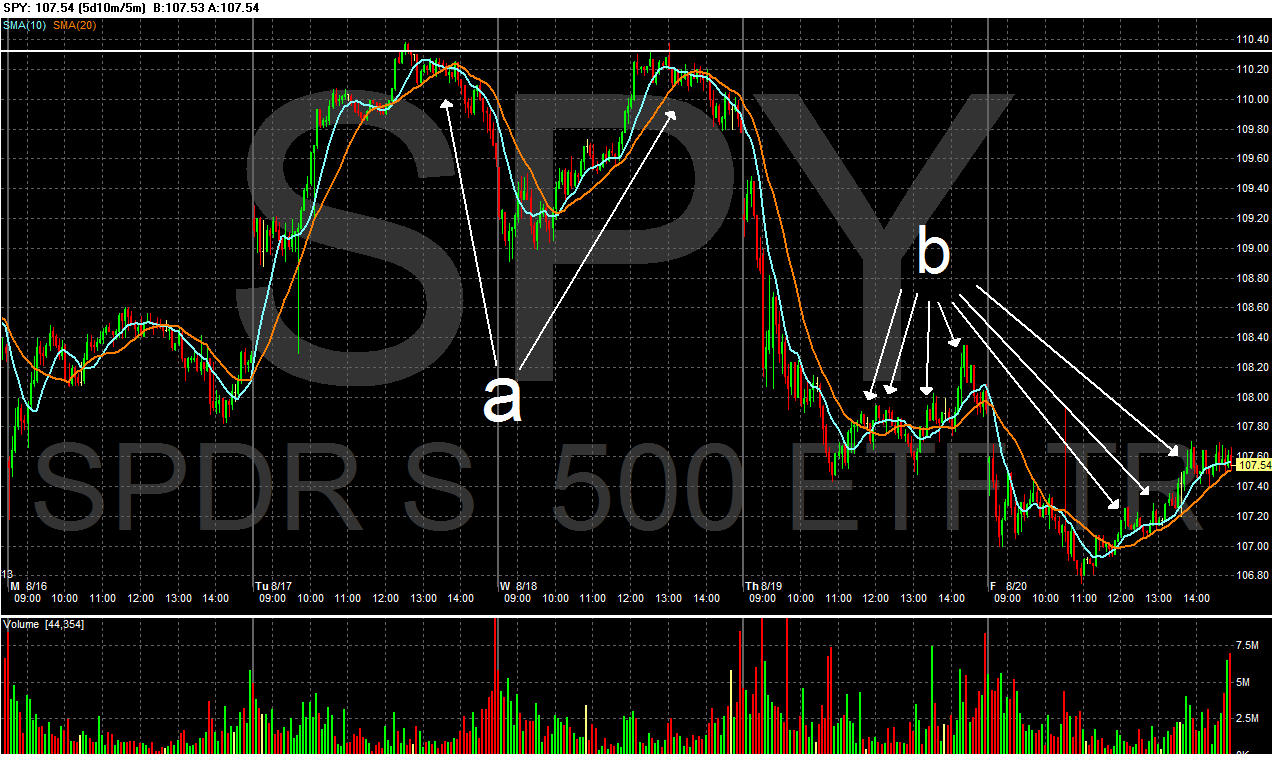
Prices gapped higher at the open (b), but hit resistance 108.5 and reversed, rallying into the 10 minute EMA (d) before hitting support t a low established last week (e and e). Prices twice tried to rally through the EMAs but couldn't get much beyond (f and g), so they sold off at the end of trading (h) on increasing volume.


In the last 8 days, we've had four gaps lower (a, b, d and e) and one gap higher (c). Also note that after the gap higher, prices hit resistance at the 200 day EMA which they could not get beyond.

In other words, the overall tone of the market is bearish right now.


One of the things I find really interesting is how the oil market has been stuck in a range for the last few months. Notice that after breaking through the $80/bbl area (a), prices fell back just as quickly (b), printing some very strong downward sloping bars. Now the EMAs are bearish with the shorter EMAs below the longer EMAs and prices below the EMAs pulling the EMAs lower. Also note the MACD has given a sell signal and momentum is clearly leaving the market.


Corn has risen in sympathy with the wheat market. Prices have moved through key resistance levels (a), but have upside resistance with line (b). Also note the EMAs are rising and there is a fair amount of space between them. There is also plenty of momentum (d), and a bit of upside left.


Soy beans -- which had been rising with wheat -- have broken their uptrend (a) and have printed some strong lower bars (b). While the longer EMAs are still rising, the shorter EMAs (the 10 day EMA) has turned lower, and the MACD has given a signal (d).


Cotton is still in a strong uptrend (a) which has consolidated gains (b) during the rally. Also note the strong EMA picture (c) although the MACD is close to giving a sell signal.

Monday, August 23, 2010

A few additions to the Site

- by New Deal democrat

With Bonddad's permission, I've made a couple of additons to the site.

First of all, on the right side I've added a list of the most recent comments, so it is easier to have and follow a conversation on any recent blog posts.

Second, I've added a few more blogs to the blogroll. I've tried to focus on some that are worthy of your attention, but not so widely followed as others.

Carpe Diem is Prof. Mark Perry's site. There are a plethora of perenially negative economic blogs, but Perry makes Bonddad and me look like suicidal Doom and Gloomers. The commentary is intelligent and is a good counterpoint to other blogs.

Tim Duy is a colleague of Prof. Mark Thoma at the University of Oregon. His economic commentary is always thoughtful.

A Dash of Insight is a trading and investment blog by Jeff Miller, with interesting meta-commentary as well (e.g., on Confirmation Bias).

Matt Trivisonno's blog is likewise about trading and technical analysis, (e.g., the recent upside breakout of the A/D line), but also includes the Daily Treasury update on withholding taxes, and some decidedly populist commentary.

Finally, Russ Winter's blog, a/k/a Winter Watch is back from behind a paywall, and so long as that lasts, he's added to the list. Russ's curmudeonly astringent humor is worth a read all by itself, but his analysis is top-notch, whether you a agree with him or not.

I hope you enjoy these, and hopefully we can add a few more goodies for you.

Regarding Government Numbers

One of the oldest arguments on the internet is the government -- or non-government numbers for that matter -- are deeply flawed and therefore useless in economic analysis. This argument falls short in one very important way: there is no proof.

Purveyors of this theory first point to the website Shadow Stats as evidence. However they are wrong. For example, according to their "methodology" the US inflation rate was over 5% for the entire decade of 2000-2010.


However during this same time the US 10-year Treasury crossed 5% three times:


Either Shadowstats is correct or one of the most liquid and heavily traded markets in the world is correct. Sorry Shadowstats, but you're way off.

Then there is the issue of "survivor bias." This theory states that surveys are biased in favor of firms that survive economic hard times, thereby skewing the numbers positively. Unfortunately, this theory is also wrong as we debunked here a while ago. Here is an example from the Census Bureau regarding retall sales.

"Births are added to the monthly survey in February, May, August, and November of each year. At the same time, deaths are removed from the survey. To minimize the effect of births and deaths on the month-to-month change estimates, we phase-in these changes by incrementally increasing the sampling weights of the births and decreasing the sampling weights of the deaths in a similar fashion. In the first month, we tabulate the births at one-third their sampling weight and tabulate the deaths at two-thirds their sampling weight. In the second month, we tabulate the births at two-thirds their sampling weight and tabulate the deaths at one-third their sampling weight. In the third month, we tabulate the births at their full sampling weight and the deaths are dropped (sampling weight equal zero)."

Then there's the issue that no one has issued any research on this topic. Here's a fun exercise. Go to SSRN -- the Social Science Research Network -- and start searching for papers from economists and statisticians on the failure of government numbers. If the problem were as widespread as some think, then there should be evidence as in an entire body of work indicting the government statistical system. However -- there is no such body of work; it does not exist.

The short version is people who have absolutely no training in statistics think they know more than the people who staff government and professional forecasting agencies -- who also happen to be trained in statistics.

The reason for this entry is to reiterate a central rule of the comments section:

2.) If you are going to challenge the veracity of government statistics you must provide a reference from a paper written by someone with at least a masters in a relevant discipline (statistics, mathematics, economics etc...). There has been a raging debate in the economic blogosphere about government statistics. The classic debate is about the birth/death model used by the Bureau of Labor Statistics. (To find out more, go to the Bureau of Labor Statistics and type in birth death in the search bar in the upper right hand corner). The BLS uses this to overcome sampling errors in their employment statistics. According to some bloggers this is a bogus adjustment which makes the numbers unreliable. However, go to www.ssrn.com -- the social science research network -- and type in birth/death in the search bar. You'll find 34 hits that center around health care systems. But there is nothing about the BLS' birth/death model. In other words, among academics in the economic and financial world, there isn't a debate (at least not yet). So, the people who should be calling bullshit -- and backing it up with data and information -- are not calling bullshit. When they are, I'll be happy to consider the information.

And please -- Shadowstats is crap.

And a second reason is people have a habit of saying, "the government statistics are wrong" when the statistics disagree with their assertions. But when the statistics confirm their assertions, the government numbers are sacrosanct.

Bottom line: these are the numbers economists use. When I see an economist with a Ph.D. say, "these numbers are flawed and I can prove it" then I'll listen. But when a guy on a blog with a political ax to grind says the same thing, well, let's just say credibility is an issue at that point.

So here's the deal. If you're going to argue that economic numbers are wrong on this blog, please prove it. And, no, your word isn't good enough. Find someone who can prove they know what they are talking about (that's what PhDs are for) to back-up your assertion. And make sure the entire paper is about the topic, not just a sentence you can mis-quote and mis-construe. Better yet, find a group of people to back-up your assertion. Until then, Mish and Daily Kos are open for business.

The S l o w - M o t i o n Bust enters a new phase

- by New Deal democrat

Way back in 2006,(see, for example, here) I started to develop a narrative for what I called "the s l o w - m o t i o n bust" -- a 19th century style debt panic that, because of all the Great Depression and post World War 2 structures put in place to prevent exactly that, would unfold in very slow motion, taking years to play out. That's why I've always cautioned that my bullishness on the US economy last year and earlier this year has been tempered by the idea that it is "Springtime during an Ice Age". In other words, it is a cyclical economic expansion that unfolds during a secular downturn that won't be over until the structural issues of debt and the declining middle class in the US are resolved.

For example, here I am on August 4, 2006 laying out a scenario:
It [ ] helps to keep a narrative in my head for how the numbers are likely to develop, and I am beginning to expect the following:

The consumer sector of the economy (the 'bonddad economy') is in recession right now (or will be imminently).
Despite that, the 1906 industrial economy (the 'kudlow economy') will continue to grow.
- The growth in the kudlow economy will continue to outweigh the nevertheless-increasing drag of a recession in the bonddad economy (daisycolorado wins her bet).
- This also means that the fed's attempt to tame inflation will fail.
- Thus, the fed will continue to have to raise rates, against its will, to preserve some value in the dollar and combat rising inflation.
- Inflation will not be brought to heel until the kudlow economy contracts (i.e., goes into recession as well).
- The consumer will be in no shape to rescue the industrial economy's collapse, as the consumer did in 2001-2.
- At some point in the next 2-4 years, we have the worst recession since and maybe including 1981-2.
- We have then reached the midpoint of the 60 year kondtrafieff interest rate cycle, and interest rates and inflation will rise in a secular manner for the next 30 years

It's a narrative, I'm chewing on it, but the more I think about it, the more it makes sense to me.

And here I am in August 2007:
[T]he "credit crunch" is real and deflationary....

But the offset to that deflation is, the global dollar glut....

These two big forces are working at cross-purposes: the deflationary credit crunch is deflationary for domestic prices. The inflationary global dollar glut is inflationary for assets that can be held by foreigners. ...

There may be Very Bad Days for either of these forces. But they are both MegaSized and will takes years to play out. Mortgage resets in particular are less than 1 year into a 5 year death spiral.

This is the end of the disinflationary cycle that began in about 1980. Debt will be punished, savings will slowly be rewarded. It is a catastrophe that will play out in slow motion.
Not perfect of course, but not a bad narrative for what did in fact unfold in the next couple of years. I would say we have been through 3 Episodes of "the s l o w m o t i o n bust". First was the Wile E. Coyote moment of late 2007 - early 2008 during which the economy hung suspended in mid-air, but hadn't dropped yet. Then we got "The Panic of 2008" (btw, that post was published in November 2007 and almost exactly laid out the panic scenario that did take place the next year) including the US's "very bad day" of Black September 2008 as the entire US financial system failed systemically and had to be propped up by massive infusions of taxpayer dollars. The third episode is The Respite, in which the bailout succeeded in stabilizing the economy, consumers slowly regained enough confidence to spend again, global trade and manufacturing resumed, and finally employment bottomed and increased (and in the private sector, is still increasing) again.

It looks like we are embarking on a new phase, that started out with episode 4: "Europe's Very Bad Day." This meltdown from March and April, as bad luck would have it, coincided with the BP Gulf disaster and the ending of the $8000 mortgage credit in the US, and was exacerbated by Congress's insane refusal for months to give revenue-strapped states the aid they needed to get through a second bad year.

Perhaps more important than those transitory effects is the "choke collar" that the price of Oil places on any US recovery. No sooner is there growth than Oil charges back to $80+ a barrel, putting it at or near the 4% of GDP level which in the past has always triggered a slowdown or recession.

Some of the above more transitory problems, such as the Gulf oil catastrophe, have resolved themselves. Others, like new home permits, appear to have bottomed. On the other hand, Greece hasn't suddenly become solvent, and the recent spike in new unemployment claims suggests that states and localities continue to lay off 10,000s of workers.

More question marks are the continuing exposure of TBTF US banks to toxic debt, and whether the Treasury's open-ended commitment to pour endless taxpayer dollars into those institutions will overcome any difficulties. Finally, the renewed downturn in home prices may mean more underwater homeowners going into foreclosure or "walking away."

In the short term, it is well to remember that we have neither the $147 Oil nor the credit crisis that drove the 2008 economic crash. Leading Indicators so far only indicate a slowdown to zero growth, not an outright double-dip recession.
In the longer term, over at least the next two years, the S l o w - M o t i o n Bust will continue to play out until the underlying systemic problems are addressed. That includes:
- house prices falling to their long term multiple of income [ h/t Housing Tracker]


- household debt being paid down to levels at or near where they were before refinancing debt became the norm (i.e., the 1980s)


- and savings rates also reaching levels closer to their long term norm (back to the 1980s as well) [h/t Calculated Risk]


Only when the toxic debt is purged from the system will the s l o w - m o t i o n bust be truly over.

Yesterday's Market


Notice that the level denoted by (a) was still technically important last week, as prices attempted to move through this level, only to be rebuffed.


There were two important events last week. First was a double top, which occurred on Tuesday and Wednesday. Secondly, notice that prices had a difficult time maintaining any momentum on any attempt to move higher on Thursday and Friday. Every time prices attempted to move through the EMAs, they got above the level but couldn't continue higher.


With all three daily charts above, notice that all the averages are really floating around the 200 day EMA. In other words, for the last three months, the markets has been trying to figure out whether it's a bull or bear market.


A big reason for the equity market's indecision is the Treasury market continues to rally. Notice the uptrend that started in early April is still in play. In addition, the EMA picture is extremely bullish (a) with all the EMAs rising and the shorter above the longer. The A/D and CMF line indicate new money is coming into the market and the MACD line indicates there is clearly some momentum going forward.

Last week, the cattle market was a big winner. Prices moved through key resistance (a and b). Prices have been in an uptrend for several months (c), consolidating gains against the EMAs (d) along the way. However, the price arc is turning pretty parabolic (e), which indicates a pullback si highly likely.


Gold was also a big winner last week. Notice that prices are in an uptrend (a) and the EMAs are slowly turning more bullish (b). Also note that momentum is increasing as well (c).

Saturday, August 21, 2010

Weekend Buried Treasure: "Ships with Sails"

- by New Deal democrat

Here is a song you have probably never heard. To appreciate it, I suggest minimizing the screen while you listen, or at least scroll down so that the video doesn't show....


Sounds pretty cool, like Santana or the Grateful Dead, doesn't it? So long as you are not fixated on the missing famous vocalist, this is a great song.

And of course, that's the problem. I mentioned a while back that as a kid, I was a big fan of the Doors. Not "Jim Morrison and the Doors," as deejays often said - and still say - like the other three guys were only there for back-up, but "the Doors." Most of the group's singles, including the iconic "LIght My Fire", weren't Morrison's songs at all, but were composed by guitarist Robby Krieger (in Light My Fire, aside from vocals, Morrison's contribution was the second verse). And what would the group's legacy be without the lengthy keyboard solos on Light My Fire or Riders on the Storm? Truth be told, when I listened to their albums for the first time way back when, it was Manzarek's keyboards, not Morrison's vocals, that hooked my attention. Manzarek may just be the most overlooked musician in the history of rock'n'roll.

"Ships with Sails" showcases just how good the three musicians were. At the same time, you can't help wondering how big a hit this would have been had Morrison survived to sing it. All of the songs on "Other Voices" were probably originally written for Morrison's voice. Krieger's bittersweet guitar at the end of "Ships with Sails" seems like an exclamation point on that loss.

Surprisingly, if you take a look at Rolling Stone magazine's list of the best singers in rock'n'roll, Morrison only comes in at number 47 - despite having a voice as emotionally evocative as Sinatra's. Maybe that's because. just as with the adolescent poetry of Edgar Allen Poe, so I outgrew the demonic and foreboding aura that centered on Morrison.

And what about the other 3 guys? Krieger and Densmore also make the list, in the 90s, as guitarist and drummer, respectively. And Manzarek? Rolling Stone lists him as the number 4 keyboardist of all time. So maybe he's not so overlooked after all.

Have a nice weekend. See you on Monday.

Friday, August 20, 2010

Weekly Indicators: Summer's Almost Gone edition

- by New Deal democrat

This week the initial strong showing of Industrial Production, up 1.0%, and capacity utilization, up 0.7%, were overshadowed by the outright decline in the Philly Fed index of -7.7, and the Initial Jobless claims report showing that new unemployment claims have shot up to 500,000 from 460,000 three weeks ago. July LEI were up anemically at 0.1. The general trend of the leading indicators for the last 4 months has been to converge on zero, which is about where I expect 3rd quarter GDP to wind up.

Here's what happened with the high frequency weekly indicators I follow:

The Mortgage Bankers' Association reported that "the[ir] Refinance Index increased 17.1 percent from the previous week and was the highest Refinance Index observed in the survey since the week ending May 15, 2009. The seasonally adjusted Purchase Index decreased 3.4 percent from one week earlier." The Purchase index remains above its lows from a month ago, and the overall trend of the last 6 weeks is sideways. It appears we've bottomed, but without any bounce back.

The ICSC reported same store sales for the week ending August 14 rose 3.3% vs. a year earlier, and declined -1.3% from the prior week. This is still a good showing, but less so than the 4% YoY comparisons we were seeing a month ago. On the other hand, Shoppertrakreported that for the week ending August 14, YoY sales were up 6.0%, and up a slight 0.8% vs. the prior week. In general, retail sales are still holding up well.

Gas prices decreased $.03 to $2.75 a gallon, back within its 3 month range, and at 9.459 million barrels consumed a day last week vs. 9.205 the same week last August.

The BLS reported 500,000 new jobless claims, the highest since last November. This is obviously bad, but I continue to caution that this data series is probably still distorted due to filings by some of the 500,000 laid off census workers, and also laid off municipal (*teachers*), state, and construction/real estate employees due to the ending of those two stimulus programs this spring are also excellent candidates.

Railfax continued U-turn upward from week, showing strong growth vs. last year in all 4 sectors: Cyclical, intermodal, baseline, and total traffic turned sharply up. Auto carloads rebounded strongly, but waste and scrap metal, although also turning upward, remained slightly below last year. As I have said in the last few weeks, rail traffic is suggesting that the double-dip is right now.

The American Staffing Association reported that for the week ending August 8, temporary and contract employment declined by -.69%, pushing the index back down to 93 (from its two year high last week of 94).

M1 declined -0.1% in the last week, but was up 1.0% month over month, and up 5% YoY, so “real M1” is up 3.7%. M2 increased 0.1% in the last week, and is up 0.4% month over month, and up 2.5% YoY, so “real M2” is up 1.2%. I would want to see real M2 up over 2.5% to feel confident that there will be no double-dip


Weekly BAA commercial bond rates dropped .08% more last week to 5.78%, still showing no sign of distress as might be found if another deflationary bust had started.

The good news in the Daily Treasury Statement. So far in August $91.0 B has been collected vs. $85.4 B a year ago, a gain of 6.5%. For the last 20 reporting days, we are also up about 6.5%, $12124.3 B vs. $117.0 B. As I discussed last week, this series shows that private sector employment is not declining.

That daily withholding taxes continue to record substantial increases, in the face of the poor initial claims, suggests that the weakness in jobs is generally coming from the public sector. The railfax data suggests that the fall-off in housing starts has already had an effect on that sector as well.

A Note on Initial Jobless Claims

One of the frustrating aspects of the initial new claims data is there is no underlying information -- that is, there is no information about what types of jobs are being lost. Here is a small peak into that information from the NY Times:

State and local governments have let go 102,000 more employees than they have added in the last three months, and economists are concerned that with revenue so depressed, school payrolls could shrink more in coming months.

A Note on the Leading Economic Indicators

- by New Deal democrat

As I have frequently pointed out, the KISS method to be right about the economy over the next 3-6 months is simply to follow the LEI. In the past it has been documented that you won't always be right, but you'll be right a lot more often than those who claim to engage in fundamental analysis" or simply rely on what other pundits say.

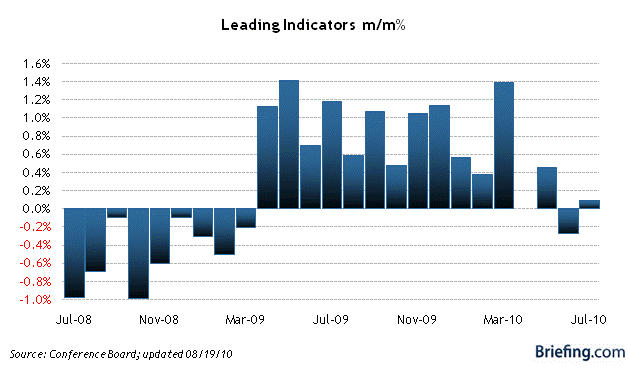
H/t to Briefing.com, here is the LEI for the last 24 months:

As you can see, they were already in steep decline in July 2008, two months before the "Black September" crash in the economy. They turned up in April 2009, 3 months before the economy as a whole bottomed. For the last four months, the best way to read them in terms of the immediate future is, converging on zero. Typically it is said that a decline in the LEI of three straight months signals a recession: we simply aren't there yet.

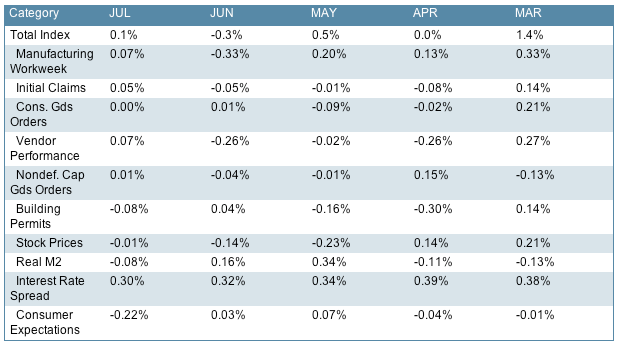
Additionally, here is a screenshot, again from briefing.com, of the reading of each indicator for the last 5 months:

Once again, you would be hard put to discern a trend in any one of those indicators. In any given month, a random member of the group is decisively up or down, and has not moved continuously from month to month. Again, what we see is, convergence on zero.

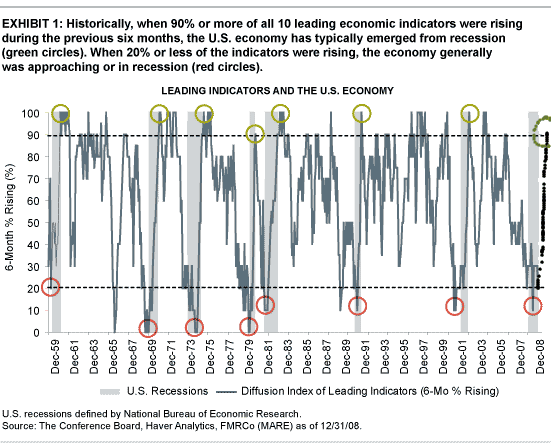
Finally, here is a graph (ending in early 2009) of a 6-month diffusion index of the indicators:

The point of this index is that, to signal recession or recovery, at least 8 or 9 of the 10 indicators should all be moving in the same direction. We are nowhere near that yet. So far, only 3 -- ISM vendor performance, building permits, and consumer expectations -- may be negative for 6 months. Stock market performance is on the edge. Initial claims may well have tipped as well, as of yesterday.

But that simply does not signal recession, rather than a slowdown, yet.

Bundesbank Increases Growth Forcast


From Bloomberg:

The Bundesbank raised its growth forecast for Germany this year after the economy expanded at the fastest pace in two decades in the second quarter.

Gross domestic product will increase by about 3 percent in 2010, the German central bank said in its monthly bulletin published in Frankfurt today, lifting its forecast from the 1.9 percent it predicted in June. Data last week showed the economy grew 2.2 percent in the three months through June, the fastest since records for a reunified Germany began in 1991.

“The growth tempo will normalize after the extraordinarily dynamic second quarter,” the Bundesbank said. “But all in all, the fundamental economic situation in Germany is very favorable at the moment.”

Booming global demand for German goods is fueling the recovery in Europe’s largest economy from last year’s recession, when it contracted 4.7 percent. While global growth is set to “moderate” in the second half of this year, curbing exports, domestic demand may pick up as the labor market continues to improve and consumers and companies increase spending, the Bundesbank said.

“It’s even a bit on the cautious side,” said Juergen Michels, chief euro-area economist at Citigroup Inc in London who expects 3.4 percent growth in Germany this year. “Germany has bounced back much quicker than everyone expected.”


Notice that about three months ago, traders thought Europe was a basket case about to fall off a cliff. Now it's a growth story. Let's take a look at the euro to see how it is faring with this change.


Prices have clearly rebounded from their lows (a), but ran into upside resistance at the 200 day EMA (b). With the prices recent fall to the 50 day EMA, we've seen the 10 and 20 day EMA move lower. Also note the weak A/D and CMF readings, indicating we're not seeing a big move of fresh money into the euro. Finally, notice that the MACD has given a sell signal, indicating momentum is clearly negative.


Yesterday's Market


Notice that stock prices have been trading in a range for the last three and a half months.


The EMA picture (a) is extremely cloudy; all the EMAs are in a very tight range. Also note that prices are centering around the 200 day EMA like it is a center of gravity for trading.


Yesterday prices gapped lower at the open and then move lower with prices consolidating gains in upward sloping pennant patterns (b). Note that is the afternoon, prices tried several times to gain above the EMAs, but just didn't have the momentum. Take a closer look at the last two rallies, and you'll see some very strong bars moving higher, but with no follow-through.


After rallying (a) and moving through important resistance levels (b, c and d), copper is now consolidating gains (e) in what appears to be a triangle forming. The EMAs are still moving higher, although at a slower angle (f). Also note that momentum is decreasing (f).


Cattle is still making new highs (a) and the EMAs are printing in a very bullish pattern (b).


Sugar is in an interesting position. First, it appears prices may be forming a double top (a). However, the EMAs are still moving higher and the shorter EMAs are above the longer EMAs (b). But, the MACD is declining. But (again), the overall 6 month pattern is a curved bottom (d).

Thursday, August 19, 2010

The NBER and dating Recessions and Recoveries: contra Calculated Risk

- by New Deal democrat

[Note: I drafted this early last month, but withheld publishing it, because it seemed "defensive." Although both Bonddad and I have written that the "great recession" ended in summer 2009, and we have been in a "recovery" since (as in economic indicators, while still bad, have improved off their bottoms), the NBER will obviously do whatever it will do. But because CR's note has been cited as authoritative, the below critique appears valuable.]

Bill McBride a/k/a Calculated Risk caused something of a stir at the beginning of July with his suggestion that, should there be a double-dip, then the NBER would probably judge it a continuation of the Recession that bottomed last June, with no intervening recovery. While I have the utmost respect for CR, and I have corresponded with him and obtained useful information from him, that doesn't mean I can't respectfully disagree. And in this case, I do.

Let me preface my reasoning with a simple, straightforward statement: this is only a question of semantics. The data is, what the data is. It is either improving or declining. Regardless, few would disagree with the blunt statement that the economy is bad, the job situation is bad, and except for CEO's and Wall Street, income is bad. Nothing in the rest of this post changes any of those statements.

CR's analysis is premised on the statement from the NBER that they did not consider the 1981-82 recession a continuation of the 1980 recession because all the important data measures had exceeded their pre-1980 highs before the second recession began. Unlike CR, I do not consider that the end of the argument. There is a difference between necessary and sufficient conditions for an event. I regard the NBER statement as indicating that the measures were sufficient to determine that there was a second, separate recession. Thus they did not have to engage in further analysis. In short, I do not believe they indicated that those criteria were necessary.

That being said, there are 5 reasons why I believe CR is incorrect:

1. Even in 1980-82, two data points -- industrial production and real retail sales -- failed to achieve their prior highs before the second half of the double-dip.

2. Similarly, in 1938, at least two measures failed to reach their 1929 highs before falling again.

3. The NBER did not wait for all measures to exceed their pre-recession highs -- far from it -- when in July 2003 they declared the 2001 recession over.

4. The strength of the improvement in the important measures in 2009-2010 generally equals or exceeds those from 2002-03, and is comparable to that in 1980.

5. The simple length of the improving data argues that the recovery, even if it ultimately fails, has been real.

Let me explain in greater detail:

1. Even in 1980-82, two data points -- industrial production and real retail sales -- failed to achieve their prior highs before the second half of the double-dip.

CR relies on four measures to make his point: Real GDP, Industrial production, Payrolls and Real Income. As shown in the graph below, however, one of the four measures -- industrial production -- never did reach its pre-1980 recession high before the 1981 recession began. So right from the outset, we know that the failure of at least 1 critical measure to reach its pre-recession high does not rule out a real recovery.

But there is more. For some reason, CR doesn't include real retail sales, although the NBER definition of what a recession is, specifically includes retail sales. Along with industrial production, real income, and payrolls, it is thought to be one of the determinants for the NBER's decision. And real retail sales failed miserably in the brief recovery between the 1980 and 1981-82 recessions, recovering only about 1/3 of their ground (about 4.5%):
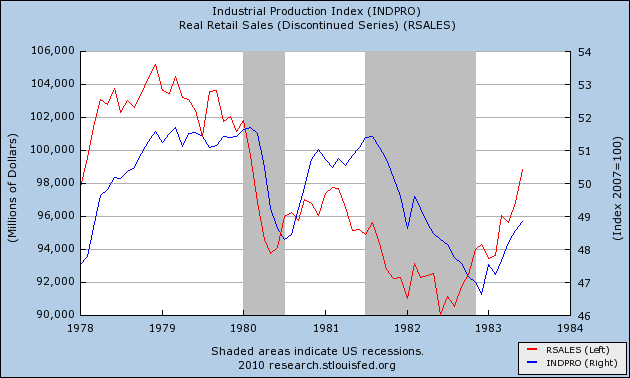

Contrast that with the present situation, in which GDP has recovered about 3/4's of its loss, industrial production has regained more than half, and real retail sales have recovered about 40% of their losses since the pre-recession peak:
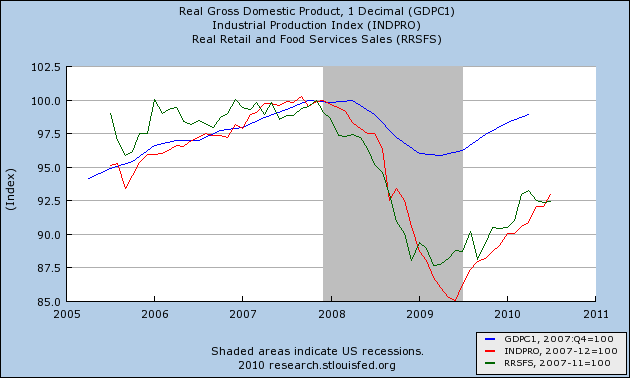

So, even considering the 1980 recession itself, it appears that 3 of 5 important measures meeting their prior highs is sufficient.


2. Similarly, in 1938, at least two measures failed to reach their 1929 highs before falling again.

The failed 1980 recovery isn't the only counterexample. During the Great Depression itself, the 1937-38 recession took place at a point when at least two indicators had failed to return to their 1929 peaks. While GDP and industrial production had indeed regained all of their lost ground from 1933-1937 (Amity Schlaes and New Deal deniers take notice):
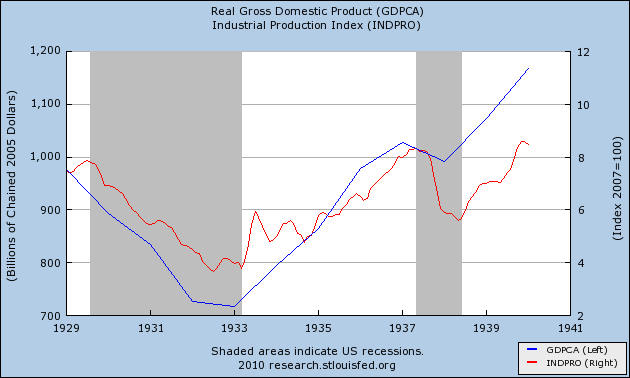

While I can't show it to you graphically, accoding to the Statistical Abstract of the United States, 1939, pp. 311-312, neither real income nor payrolls had come close to equalling their 1929 highs, in both cases having made up only about half of the ground. Despite this, 1938 is not considered a continuation of the 1929-32 downturn. Rather, it has been dubbed "The recession within the depression." In other words, the 1938 recession, which did not establish new bottoms worse than the 1932-33 bottoms, was considered an interruption in the recovery from those lows, rather than an extension of the previous downturn. If a new downturn should begin that does not return us to the 2009 lows, there is no reason to consider it part of that same recession, for the same reason.


3. The NBER did not wait for all measures to exceed their pre-recession highs -- far from it -- when in July 2003 they declared the 2001 recession over.

The NBER declared that the 2001 recession was over in July 2003. Here is how real GDP, industrial production, payrolls, and real income looked as of that month:
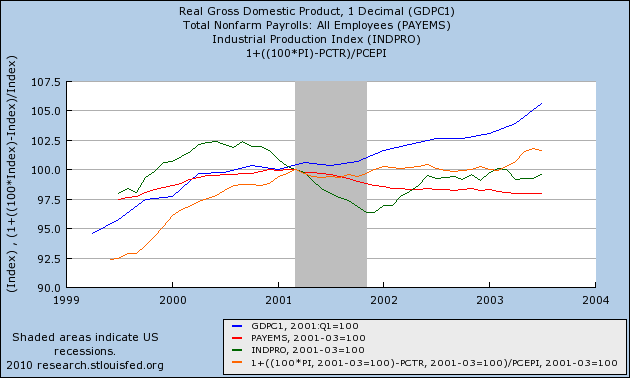

Note that GDP never really even took a hit during that recession. It declined in 2 of 3 quarters during 2001, but finished the recession higher than the point at which it began! By July 2003, real income had also regained its lost ground. But industrial production had at best made up 2/3 of its lost ground, and employment was still in decline! Despite all this, the NBER declared the recession over. (The 2001 recession was a business investment recession, real retail sales never actually declined in any sustained fashion).


4. The strength of the improvement in the important measures in 2009-2010 equals or exceeds those from 2002-03 (and several of those from 1980).

CR believes the NBER will consider the strength of the growth against the power of the previous decline. Should they? They certainly make no such relativistic declaration in any of their definitions of recession and recovery. So let's compare the strength of the current growth with that of the 1980 and 2002-03 recoveries discussed above:

Since bottoming in 2009, real GDP is up about 3%. Industrial production is up 8%. Real retail sales were up 6.5% as of May. Real income is up about 1.5%. Only payrolls continue to stink, up only about 0.5% from their December bottom.

A year after the end of the 2001 recession, by contrast, GDP was up about 2%. Industrial production was up 3%. Real retail sales were actually still down slightly, about -0.5%! Real income had at most been up 1.5% . And of course, payrolls were still declining. If in 2003, the NBER could consider that a period of recovery, then it certainly ought to count as a period of recovery now.

Comparing with one year after the 1980 recession, GDP was up 3.5%, industrial production was up about 6%, real retail sales were up at most 4%, real income was up 10%, payrolls were up 1.5%. While real income surpassed its current growth by a very strong margin, and payrolls were significantly better, both GDP and industrial production growth were similar, and of course, real retail sales was not nearly as good as present.

In short, the strength of growth in the last year is similar to that which in the past the NBER has said constituted a recovery.

5. The simple length of the improving data argues that the recovery, even if it ultimately fails, has been real.

Finally, leaving the subjective judgments of the NBER aside for a moment, the length of the growth since last year is such that a more simple, objective approach argues that it qualifies as a recovery. Generally, in lay terms it is frequently said that a recession is 2 quarters of negative growth. The 2001 recession stretched that definition because the 2 quarters were separated by one quarter of growth. If we go by this simple rule, then two consecutive quarters of growth after a period of contraction ought to count as a recovery. We've already had 3, and everyone expects that the second quarter of 2010 will also be shown to have grown, making it four quarters in a row. For good measure, we've also had 4 quarters of growth in industrial production, 3 quarters in real income, 2 in payrolls, and 5 in real retail sales. If we lay aside subjective judgments and go by the math, that's a recovery, pure and simple.

CR argues that the NBER uses a relativistic approach to dating recoveries. But if growth is judged not on its absolute strength, but only relative to the decline that preceded it, then why shouldn't the same be used for declines? How could a relativistic approach justify calling what happened in 2001 a recession at all, since compared with prior growth, it was a hiccup, and consumers blazed right through? Why should we have a relativistic measure for one side of the coin - growth - but not the other side - decline?

And if we are to use a relativistic approach, consider what that means for the 1930s. The NBER would have had to wait until all the data from 1937 was in, in 1938, to declare that the Great Recession ended, in business cycle terms, 5 years earlier in March 1933! Is there anyone at all who thinks that is a useful approach?

In Conclusion, obviously we can't know what the NBER will do. And, to reiterate above, we are only dealing with semantics, not facts on the ground. But there is good reason to believe that if the NBER is to be consistent with its earlier datings, once it is satisfied that any new downturn will not return us to the lows of the 2008-09 downturn, it should declare that recession ended in the later part of 2009.

Crap Numbers


From Bloomberg:

Initial claims are piling up, indicating that businesses are continuing to cut costs. Initial claims came in at 500,000 in the August 14 week for the largest total since November. The four-week average of 482,500 is the largest since December. A month-to-month look shows significant deterioration of 25,000 for a percentage change of nearly six percent. The Labor Department said special factors are playing no part in the data.

But not all the news is negative. Continuing claims continue to come down, down 13,000 in data for the August 7 week. The four-week average of 4.527 million is the lowest of the recovery.

Today's report points to trouble but not catastrophic trouble for the monthly employment report. Note the rise in initial claims betrays a lack of business confidence in the economic outlook. Stock futures are moving lower following the report while money is moving into the safety of Treasuries.


Let's take a look at the data:


This number was coming down during the last six months of last year . However, the number has stalled for this year (a) and is now at the 500,000 level (b). While I agree with NDD that the lack of underlying data means this could be a temporary increase caused by Census/governmental/construction losses, the reality is the total number could not come at a worse time. We've been seeing weakening numbers from the manufacturing sector for the last few months (see today's -7.7 print from the Philly Fed), indicating this sector -- which led us out of the recession -- is losing steam. Now we have initial unemployment claims at a big, fat round number: 500,000. That is terrible news with little to no upside in my opinion.

After four quarters of GDP growth, we're seeing clear signs of weakness.

500,000 New Jobless Claims is bad. But...

- by New Deal democrat

Since Bonddad hasn't posted on this (yet), allow me to make a few comments:

1. 500,000 new jobless claims is bad. No doubt about it. Since it is a "short" leading indicator, this just adds more confirmation that 3rd quarter GDP will be roughly zero, and could easily be negative.

2. It also means that nonfarm payrolls for August will probably stink as well. The "breakeven" point between non-census gains and losses this year has been about 475,000-480,000.

BUT... We don't know what sectors the new claims are coming from.

3. The census is laying off workers more quickly than most thought. By August 7, they were down to 75,000 employees. About 500,000 census workers have been laid off in the last 13 weeks, and some of them depending on the state qualify for unemployment benefits. This will be almost over in a few weeks.

4. The Congressional aid package to the states was not big enough and it was late. We are now at the weeks when thousands of schoolteachers nationwide are finding out that they are unemployed, and you can bet that nearly 100% of them are filing for benefits. This too will probably tail off once September begins.

5. We are down about 100,000 housing starts since April. Construction workers and real estate sector finance workers have already suffered layoffs. Whether those will abate or not is unknown, but they certainly came quicker than was the case in 2006-07.

6. BP has been laying off cleanup workers in the Gulf states. This is obviously temporary too.

If the increased layoffs remain concentrated in the census and in areas where the stimulus expiration has hit, there will be a reversal in September. The real danger is whether the sectors laying people off have expanded beyond that. We won't know that till the August jobs report in two weeks.

In that regard, if you want to be worried, worry about the negative Philly Fed report this morning. If outright weakness is spreading to manufacturing, that is an ill omen indeed.

Australia Wheat Crop Hit By Drought


From Agrimoney.com

While traders cited continuing pressure on prices from funds selling up, and farmer selling, the prospect of a weak grain harvest in Western Australia, Australia's top grain state, was helping keep bulls' hopes alive.

Drought is expected to cut by 33% to 5.5m tonnes, the state's wheat harvest, the Western Australia Grains Industry Association said.

While some farms had received some rain last week, "soil moisture assessment shows that most areas have little, if any, available moisture to sustain plant growth", the association said.

"Should the current pattern of irregular rain with lengthy fine spells continue, it is likely that production estimates will be revised downward further in September," the group added, in a report the day after the Australian Oilseeds Federation also warned over the state's plight.

Prices have broken their primary uptrend (a) at (c). In addition, note the shorter EMAs have moved lower (b).


However, prices are nowhere near the highs achieved a few years ago.

Yesterday's Market


Yesterday, prices traded between two important technical levels, the first established over a week ago (a) and the second from the previous days trading (b).


Prices moved lower at the open but found support from the previous days levels (a). Prices consolidated in a triangle pattern for the first bit of trading (b) broke through resistance anbd rallied higher forming two more triangles to consolidate gains (c). Prices hit resistance at levels established over a week ago (d) and then sold off into the close on rising volume (e).


Notice how the three largest market sectors of the SPYs -- technology, financials and health care -- have been trading in a range for the last few months.


The long end of the Treasury curve -- the TLTs -- has moved back above the long-term trend line (a) and has moved moved through important resistance as well (b). Also note that prices have gapped higher (c), indicating a several mis-match between supply and demand.


The gold market is once again in an uptrend (a). Also notice the shorter EMAs are about to cross over the longer EMAs (b) and the MACD has a lot of room to run as prices move higher (c).


Yesterday the cattle market hit a 6-month high.