Well (sigh), Mish is at it again.
He claims that retail sales aren't actually increasing because state sales tax receipts are in continued decline on a YoY basis. Once again, he misuses YoY comparisons, and ignores them when they contradict his case (which is often). This is the very same type of analysis he did back in June when he claimed that "Rail traffic is horrific with no end in sight." I called him on that, pointing out that simple YoY comparisons, without noting the most current trend in those comparisons, missed turning points -- and that it looked like more recent comparisons showed that rail traffic was about to turn up. In fact that is exactly what happened, and for some reason Mish hasn't commented on rail traffic in awhile.
He had the same problem analyzing the CS-CPI, noting in September how awful it was on a YoY basis, citing February 2009 YoY data! In fact, as I pointed out, that metric too was improving YoY, and as we saw last week, the CS-CPI is now positive YoY. For some reason Mish hasn't commented on the CS-CPI for awhile either.
Now he is making the exact same error with regard to state sales tax receipts. The meat of Mish's article is that state sales taxes continue to get worse and worse. He quotes or lists reports by state for 6 states, and I will not only rebut him state by state, but will examine several more states examined in an article to which he links apporivingly.
I. The starting point for our examination is national sales tax information. To begin with, Mish makes the observation that
unadjusted numbers vs. a year ago are the only valid way of looking at data. Same store sales, comparisons to projections, and non-seasonally adjusted comparisons to the previous month are all bogus comparisons.I agree that, if we can't gauge seasonality in the data to enable valid month-over-month comparisons, then we should at very least take a look on a month-by-month "unadjusted numbers vs. a year ago" to see whether the YoY comparisons are getting better or worse -- this is what Mish failed to do with either railroad data or the CS-CPI, and why both of those data series moved against him.
To show you what I mean, let's look at the actual retail sales series, unadjusted for inflation. In the graph below, the amount of sales are in blue, measured on the right scale; the YoY % change is in red, measured on the left scale:
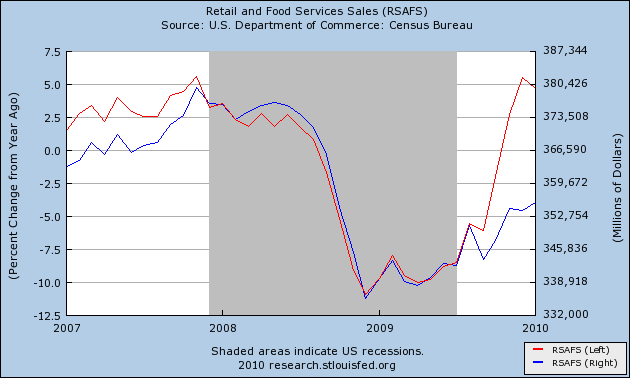
Now this graph is pretty straightforward. Both measures hit their low point in December 2008 -- but the YoY % change didn't turn positive until 11 months later, in November 2009!
Now this graph is pretty straightforward. Both measures hit their low point in December 2008 -- but the YoY % change didn't turn positive until 11 months later, in November 2009!
So if state sales tax receipts were consistent with that, on an apples to apples basis, the YoY unadjusted receipts Mish cites ought to start turning positive in November 2009, even though the actual bottom was nearly a year before. Furthermore, the maximum YoY % decline should have occurred in December 2008.
II. Now let's turn to Mish's argument and the actual data.
As to the national sales tax data, John Liscio puts out a monthly compilation of state sales tax receipt information. According to a Reuters summary of his December 2009 report, 13% of states showed growth, compared with none showing growth in November. You would think that would be an improvement in the trend. Not according to Mish:
"note that only 13% of states are reporting growth which means that 87% of states have flat to declining sales. Amazingly the headline has a positive spin that revenues was up.Except that the article very specifically uses "unadjusted numbers vs. a year ago." exactly what Mish calls "the only valid way of looking at data." The article says:
Even then, close observers will note that revenues were up vs. projections. That does not mean they were up at all. That was very sloppy reporting, at best."
In November, no state registered sales tax revenue growth over the year, but by December 13 percent enjoyed growth.(my emphasis)
.... Those numbers could change quickly, it said. The states reporting year-on-year growth were concentrated in the Midwest, where the federal automobile industry bailout boosted manufacturing sales and inventories.
The data support exactly what the Reuters story claimed, and the data is reported exactly the way Mish claims is the only correct way to report it. So it is Mish, not the reporter, who has a sloppy, spinny way of looking at the data. And the data turns positive in 1 in 4 states only one month after the unadjusted retail series discussed above.
In a subsequent post, just to "drive home" his point, Mish posts the following graph of sales tax receipts:
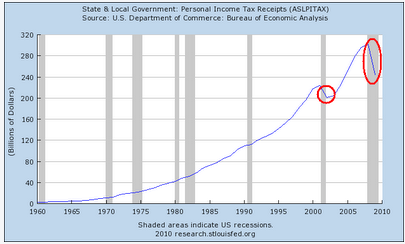
If minds were truly inquiring, they would note that this is a graph of annual data, with the most recent data point that for the entire year of 2009, which as we've pointed out above obviously came in less than 2008 when the recession was just getting underway. Duh! This is badly lagging data and tells us zero, nada, zip, nothing about the current trend. For that, we have to examine monthly data, which we'll do below.
As an aside, Mish is so proud of himself that he actually also cites this graph:
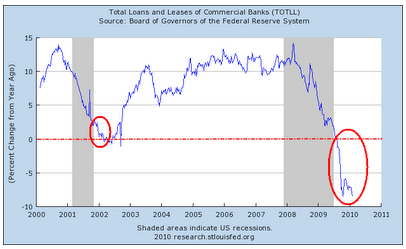
as further proof that the recession isn't over, and helpfully circles bottoms, which very clearly show that the data series is a lagging indicator that in the past has bottomed after the recession ended. That's His. Own. Graph!
III. In support of his thesis, Mish copies and pastes news reports or data from 6 states: New York, Indiana, Texas, Tennessee, Alabama, and Georgia. Let's look at what the monthly data on sales tax collections for each of those states actually shows.
Mish cites a newspaper article about New York that compares 2009 to 2008 collections on an annual, not monthly, basis, and found a 5.9 decrease in collections statewide. Not only is it a no-brainer that tax collections got worse as the recession deepened from the first to second year, but this method, of course, is precisely NOT what Mish claimed was the proper way to look at sales tax collections. In fact, had he actually checked by month, he would have found that
- in January 2010, sales tax receipts were down -2.0%.
- In December, they were UP 5.0% YoY.
- In November, they had been down -4.3% YoY.
- In October they were down -3.3%.
While the trend is a little erratic, it is nevertheless improving.
Next Mish cites Indiana, and gives the following list of monthly comparisons (YoY percentage changes are mine):
December 2009 Sales Tax: 476,111,101.58 (-4.3% YoY)
December 2008 Sales Tax: 497,628,352.13
November 2009 Sales Tax: 473,363,430.53 (-6.1% YoY)
November 2008 Sales Tax: 504,327,778.19
October 2009 Sales Tax: 485,658,222.21 (-11.1% YoY)
October 2008 Sales Tax: 546,284,648.12
In other words, the trend is that Indiana's sales tax receipts are rapidly approaching positivity YoY, and may well have bottomed in November 2009.
Texas is literally the ONLY state whose sale tax receipts support Mish's opinion. Mish gives the following list (again, YoY percentages are mine):
January 2010: $1,655.3 million (-14.2% YoY)
January 2009: $1,928.3 million
December 2009: $1,653.1 million (-11.6% YoY)
December 2008: $1,869.4 million
November 2009: $1,696.9 million (-15.4% YoY)
November 2008: $1,983.1 million
October 2009: $1,517.9 million (-12.8% YoY)
October 2008: $1,739.8 million
I'll give him Texas.
Mish next turns to Tennessee. whose tax commissioner, Dave Goetz said as to January 2010,
Since I don't have a clue what Mr. Goetz actually meant, I went to the data, which showed that total Tennessee tax collections were actually UP 1.16% from a year ago. To be fair, since I want to stick with sales taxes,
Next Mish cites Indiana, and gives the following list of monthly comparisons (YoY percentage changes are mine):
December 2009 Sales Tax: 476,111,101.58 (-4.3% YoY)
December 2008 Sales Tax: 497,628,352.13
November 2009 Sales Tax: 473,363,430.53 (-6.1% YoY)
November 2008 Sales Tax: 504,327,778.19
October 2009 Sales Tax: 485,658,222.21 (-11.1% YoY)
October 2008 Sales Tax: 546,284,648.12
In other words, the trend is that Indiana's sales tax receipts are rapidly approaching positivity YoY, and may well have bottomed in November 2009.
Texas is literally the ONLY state whose sale tax receipts support Mish's opinion. Mish gives the following list (again, YoY percentages are mine):
January 2010: $1,655.3 million (-14.2% YoY)
January 2009: $1,928.3 million
December 2009: $1,653.1 million (-11.6% YoY)
December 2008: $1,869.4 million
November 2009: $1,696.9 million (-15.4% YoY)
November 2008: $1,983.1 million
October 2009: $1,517.9 million (-12.8% YoY)
October 2008: $1,739.8 million
I'll give him Texas.
Mish next turns to Tennessee. whose tax commissioner, Dave Goetz said as to January 2010,
For the first time in many months, the total Tennessee tax collections were actually a bit above the level of the prior month a year agoMish actually highlights the fact that the receipts came in less than estimates -- again, not the method he himself accepts as being valid.
Since I don't have a clue what Mr. Goetz actually meant, I went to the data, which showed that total Tennessee tax collections were actually UP 1.16% from a year ago. To be fair, since I want to stick with sales taxes,
- in January, those were down -1.8% YoY.
- This is better than December, when sales tax collections were down -2.9% YoY.
- November's were down -4.5% YoY.
Tennessee doesn't support Mish's argument either.
Mish makes his most hilarious mistake when he turns his attention next to Alabama,, citing an article that states:
In short, Alabama's statistics actually contradict rather than support Mish.
Finally, Mish turns his attention to Georgia, citing an article noting that
IV. Mish next cites approvingly to a Motley fool bulletin board piece dating from November -- four months ago now. That piece listed 7 states who were all showing increasingly bad tax collections through October or November, some of which are those discussed above. I followed up on the others, and here is the current status through January 2010 sales tax collections:
Tennessee doesn't support Mish's argument either.
Mish makes his most hilarious mistake when he turns his attention next to Alabama,, citing an article that states:
Taxes collected by the state Education Trust Fund continue to jump around from month to month, with tax collections in January dropping 17.5 percent, or $80.7 million, compared to January 2009, the state finance department reported Monday.Of course, the discussion isn't about corporate or estate taxes, it is about sales tax receipts, and had Mish moved his gaze ever so slightly to the left, he would have seen, clear as day in the accompanying chart, that sales tax receipts were UP 7.2% in January 2010 vs. January 2009.
That followed a gain of 13.5 percent in December compared to December 2008 and a drop of 6.7 percent in November compared to November 2008.
In short, Alabama's statistics actually contradict rather than support Mish.
Finally, Mish turns his attention to Georgia, citing an article noting that
It was another tough month for Georgia revenue collections. Governor Sonny Perdue’s office says for the month of January, collections dipped 8.7 percent from the same month a year earlier. That now makes it 14 straight months of declining tax revenue.That's certainly looks bad, but again Mish fails to take account of the trend. Specifically, in December 2009, Georgia reported that
The Peach State pulled in $1.4 billion, compared with $1.49 billion in December 2008.Like Indiana and Tennessee, the Georgia statistics show continuing improvement, and a likelihood that the bottom on a monthly basis has already taken place.
The $1.4 billion last month included $347.4 million in sales tax revenue (down 20.2 percent),
IV. Mish next cites approvingly to a Motley fool bulletin board piece dating from November -- four months ago now. That piece listed 7 states who were all showing increasingly bad tax collections through October or November, some of which are those discussed above. I followed up on the others, and here is the current status through January 2010 sales tax collections:
While in California "through December, the state’s tax revenue take was down 13.7 percent to $7.25 billion," January's tax receipts were UP YoY, and in particular "Sales Tax came in about 80% higher than January 2009." which one California blogger called "finally a ray of hope that California is turning the corner on the recession."
In Florida, January sales taxes were down -4.3% YoY. But the trend was clearly improving, as December was down -4.9% YoY, and November down -8.1% YoY.
Similarly, in Pennsylvania January 2010 sales taxes were down -1.1% YoY, compared with December 2009 when they were down -1.7% YoY, and November 2009 when they were down -6.1% YoY.
In New Jersey January 2010 receipts, reflecting the bulk of the important holiday shopping season, increased by 1.9% over last January, the first monthly increase since May of 2008."
Finally, in Ohio. "January receipts were 5.2% above the same month a year ago."
To summarize: of the 11 states we have looked at, 4 actually have increased sales tax receipts compared with a year ago, 6 although negative YoY show improving YoY comparisons and probably have already hit bottom on a monthly basis, and exactly 1 - Texas - actually supports Mish's case. Oh, and one more thing: while I haven't been able to check all 11 states yet as to when their maximum YoY % decline occurred, I have done 7 of them. In 6 of the 7 -- New York, California, Tennessee, Florida, Ohio, and Pennsylvania -- the maximum YoY% decline in sales tax receipts was in December 2008. In the 7th - New Jersey - it was in November 2008.
While this isn't exactly the same as the retail sales' November 2009 YoY% turning point, it isn't an apples to apples comparison either. For example, many if not most states do not charge sales tax on necessities like food and clothing. Others do not include their gasoline taxes in the sales tax figure. Some do not record tax receipts until a month after the retail sales take place. It should hardly be surprising that this may lead to some differences in the statistical reports.
V. Finally, Mish also claims that the Census Bureau's retail sales data is bogus, claiming that it fails to account for "survivorship bias", in other words, that same store sales will increase if there are a fewer number of retail stores left. What Mish believes the Census Bureau lacks is - a birth/death model!
In fact, the Census Bureau statisticians are not idiots, and do account for this in a number of ways. The following description comes from my co-blogger, Silver Oz, this site's resident statistical geek:
From How the surveys are collected:
"Births are added to the monthly survey in February, May, August, and November of each year. At the same time, deaths are removed from the survey. To minimize the effect of births and deaths on the month-to-month change estimates, we phase-in these changes by incrementally increasing the sampling weights of the births and decreasing the sampling weights of the deaths in a similar fashion. In the first month, we tabulate the births at one-third their sampling weight and tabulate the deaths at two-thirds their sampling weight. In the second month, we tabulate the births at two-thirds their sampling weight and tabulate the deaths at one-third their sampling weight. In the third month, we tabulate the births at their full sampling weight and the deaths are dropped (sampling weight equal zero)."And here is the reliability of the survey:
The alleged survivor bias argument appears to be addressed by both the methodology and the error in the survey itself, as the survey seems to take a gross sales number (ie dollars) and uses IRS and EIN's to identify firms for the survey (including deaths). So, while he is correct in that surviving firms have a bigger slice of the pie (master of the obvious!), that does not imply that the pie itself necessarily shrunk and the methodology seems to take care of his fears.
To which I would add that the Census Bureau also uses a chain weighting which ensures month to month consistency:
Estimation and sampling varianceIn other words, the Census Bureau tracks respondents for several months. If any go out of business, they get zeroed out. The statisticians aren't dunces. They account for exactly the issue Mish complains about, except he wasn't inquiring enough to check their actual procedures.
Advance sales estimates for the most detailed industries are computed using a type of ratio estimator known as the link-relative estimator. For each detailed industry, we compute a ratio of current-to-previous month weighted sales using data from units for which we have obtained usable responses for both the current and previous month. The For each detailed industry, the advance total sales estimates for the current month is computed by multiplying this ratio by the preliminary sales estimate for the previous month (derived from the larger MRTS) at the appropriate industry level. Total estimates for broader industries are computed as the sum of the detailed industry estimates.
So I suppose in a couple of months, just like rail traffic and the CS-CPI, we won't be hearing about state sales tax receipts from Mish either.