Monday, November 12, 2007

Like Lemmings Off a Cliff....

From Morningstar:

Embattled mortgage lender Countrywide Financial Corp. in a regulatory filing conceded that if its credit ratings fall below investment grade, its access to the public corporate-debt markets "could be severely limited."

Additionally, ratings agencies cutting its debt to junk status would lead to higher rates when the company renegotiates its financing arrangements beyond current maturity dates.

......

The three ratings agencies -- Moody's, Standard & Poor's and Fitch -- currently have investment-grade ratings on Countrywide, but they all have affixed the ratings with some form of negative outlook, Countrywide said. S&P and Fitch both rate Countrywide's long-term debt BBB+, while Moody's has a Baa3 rating. The cutoff for investment grade is considered a long-term rating of BBB- , or Baa3 from Moody's. Bonds rated below BBB- are considered junk.

As of Sept. 30, up to $5.5 billion of Countrywide's custodial deposit accounts on deposit with the bank could be affected if the credit rating fell into junk status, according to the filing.


When Countrywide made their latest earnings announcement, they said their problems for the quarter were the low point and the company would turn around. This despite the fact they announced 10,000+ in layoffs, a big increase in their loan loss reserves and a big writedown of their mortgage portfolio. The market cheered that announcement. The sheer gall it took for Countrywide to say their problems were the trough is simply amazing. What's more amazing is people bought it, especially in light of the current credit market environment.

Now we know the ratings agencies (whose own credibility is severely damaged right now) have Countrywide on negative credit watch. Raise your hand if you think Countrywide has seen the low point in their respective business cycle. For those of you who raised your hand, I've got some great investment opportunities in Florida real estate....

What Inflation?

From Morningstar:

Tyson Foods Inc. said Monday it swung to a fourth- quarter profit from a year ago, helped by cost cuts and operating profits in its chicken and beef businesses.

Still, Tyson shares slipped to a new 52-week low on a bleak forecast for fiscal 2008. The world's largest producer of chicken and beef warned it faces $300 million in increased grain costs for its chicken unit and "extremely difficult" conditions in its beef business.


Tyson should just suck it up. Their costs aren't core inflation measures so they don't count at all. What crybabies.

Sunday, November 11, 2007

Week's Preview: Houston, We've Got a Problem

Going into this trading week I am deeply concerned about the markets. My posts from the weekend made the following points. To summarize:

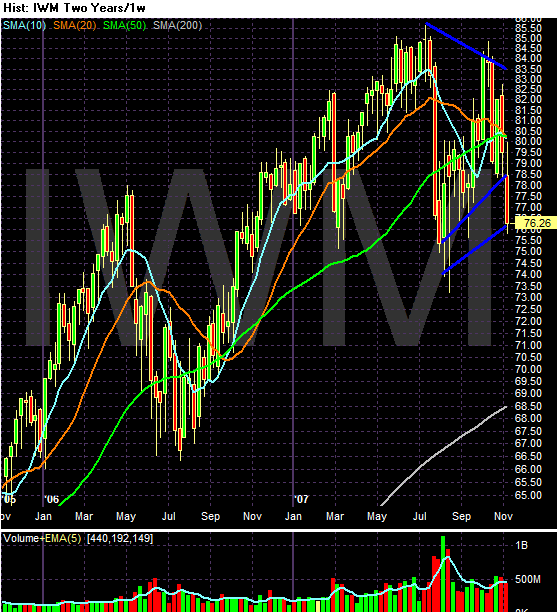
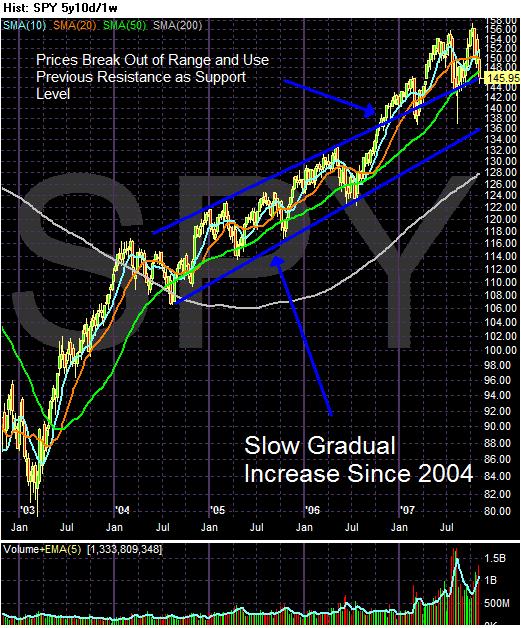
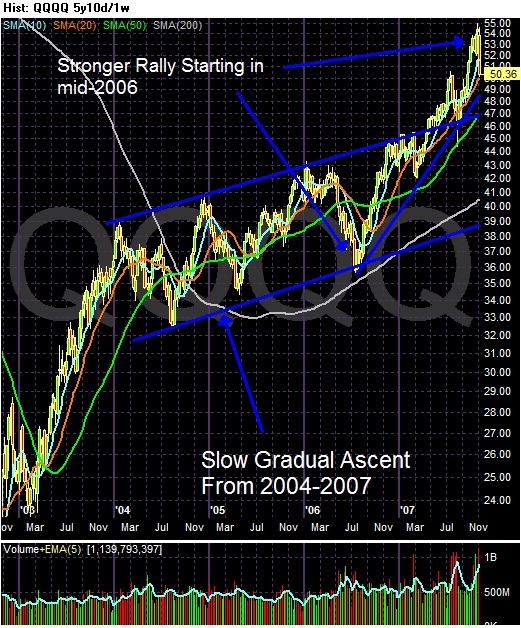
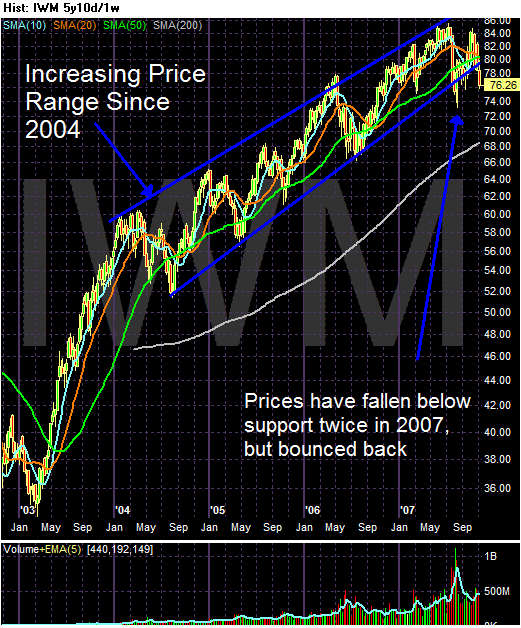
1.) The long-term (5 year) trend is still intact for the SPY and QQQQs. However, the IWM's (Russell 2000) are in a technically precarious position. They are trading right at long-term (multi-year) year support. Assuming the Russell 2000 is a proxy for risk appetite this should cause concern because it indicates traders are moving away from riskier areas of the market. Also see this post regarding the Russell possibly breaking through support in a consolidation triangle.

2.) I've advanced the theory that the SPYs have printed a double top this year, with those double tops occurring at the same level as previous highs nine years ago. In addition, the SPYs are seriously beginning to look like they are in a bearish pattern of lower highs and lower lows. Considering the general economic backdrop of the US economy right now, further continuation of the lower high/lower low seem far more likely.

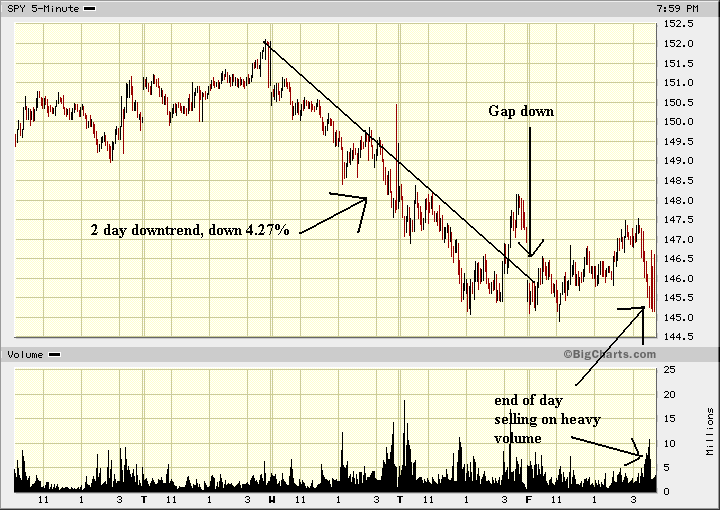
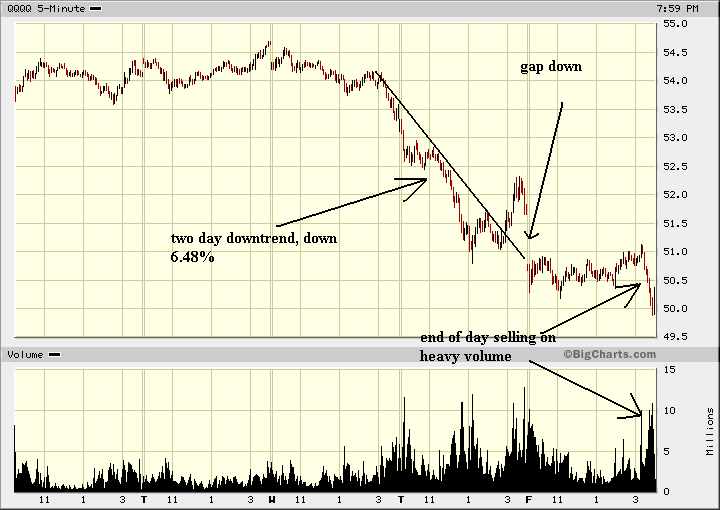
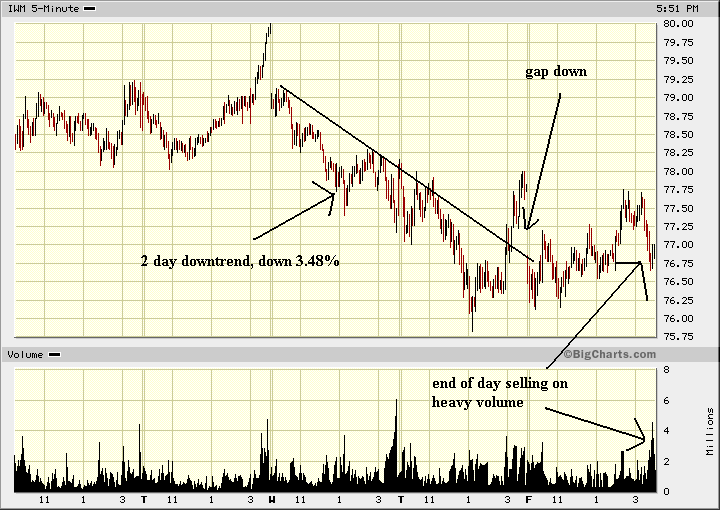
3.) Last week's 5-minute chart shows three consecutively bad days, with a high-volume sell-off at the end of trading on Friday.

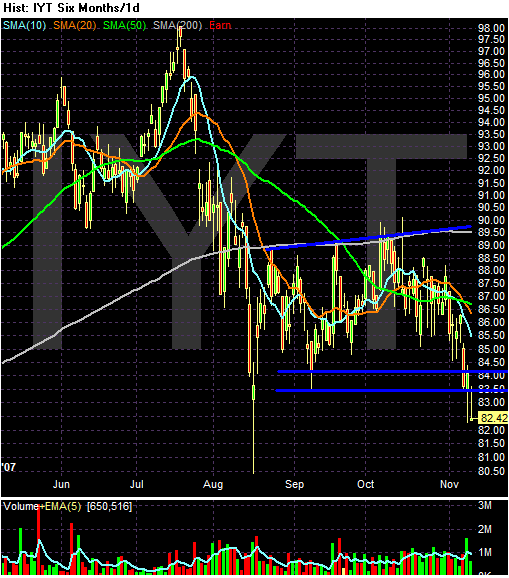
4.) The transports have broken technical support.

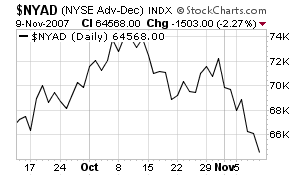
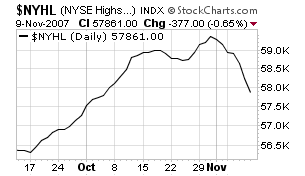
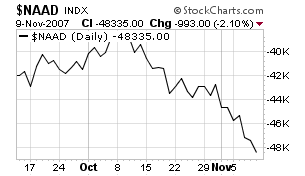
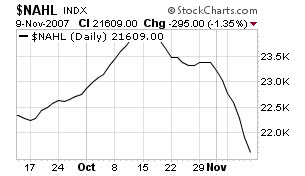
Market breadth is negative across the board.


NYSE advance/decline


NYSE new highs/new lows


NASDAQ advance/decline


NASDAQ new highs/new lows


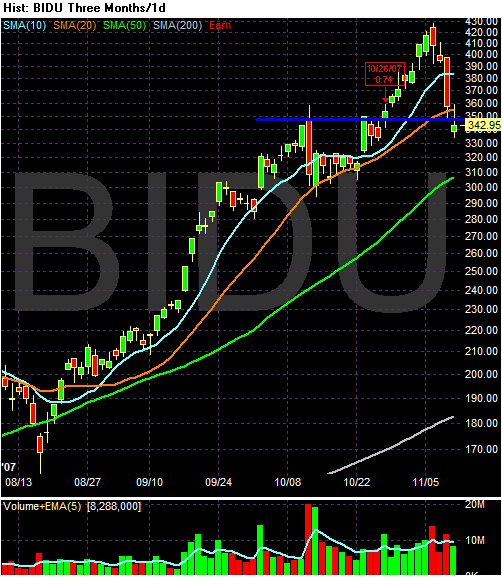
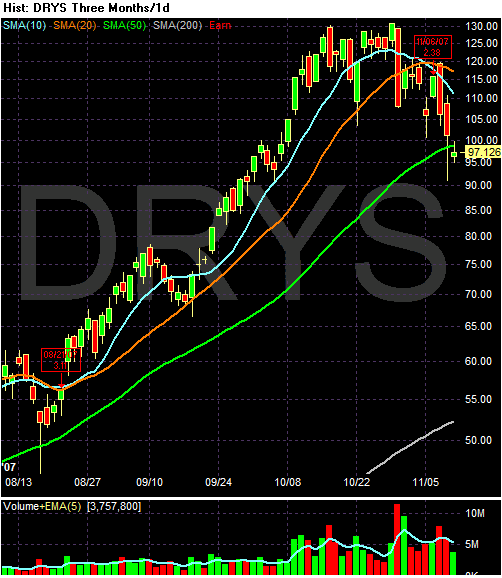
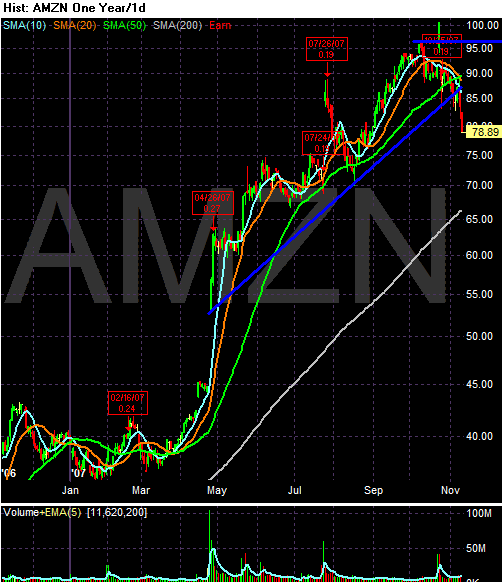
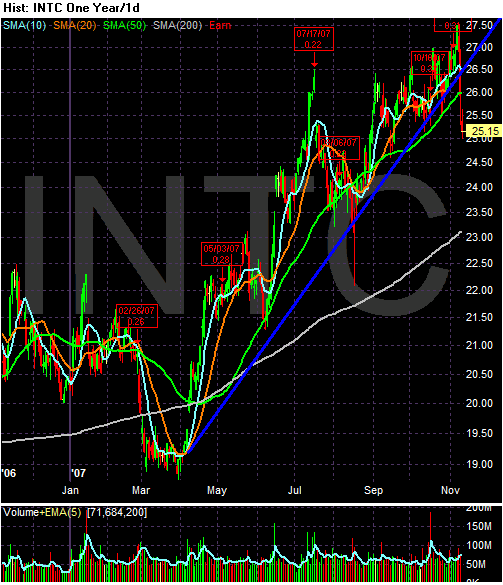
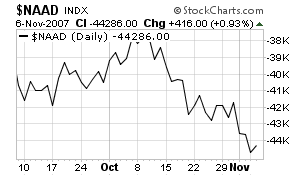
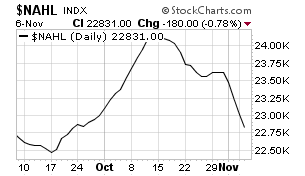
Now -- reference the NASDAQ advance/decline chart from above. A declining advance/decline line means fewer and fewer stocks are participating in the rally. Last week, we saw some of the market's high fliers break trend as well.

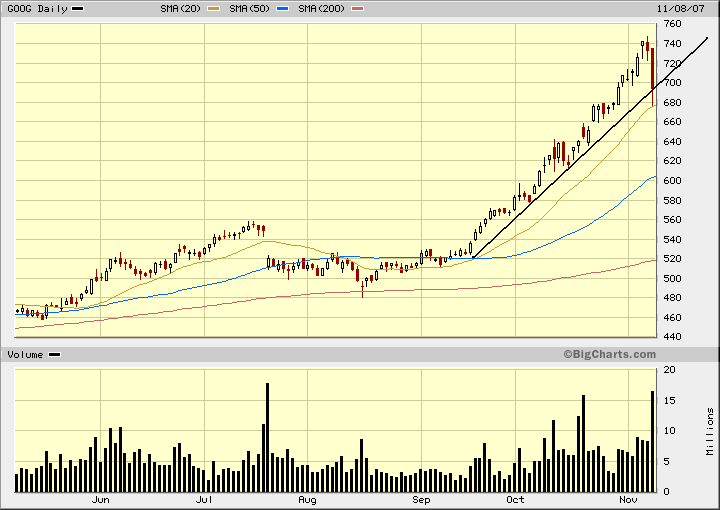
Google


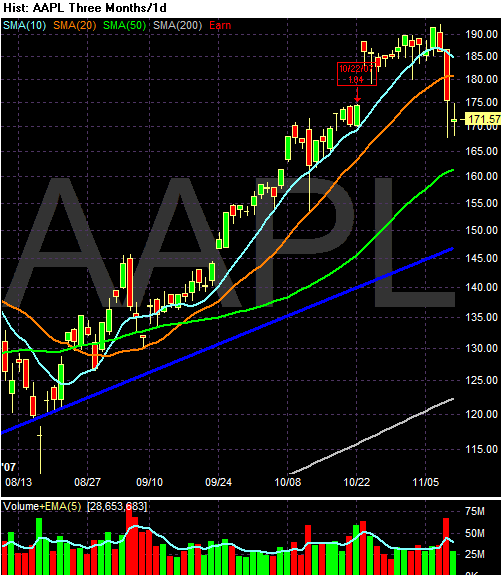
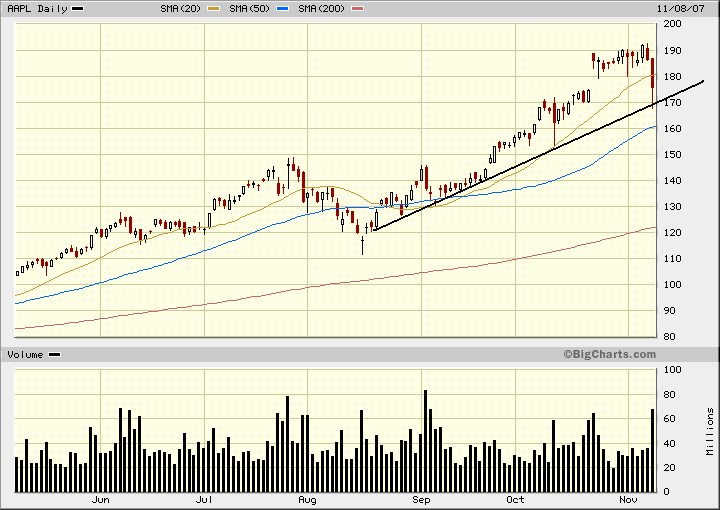
Apple


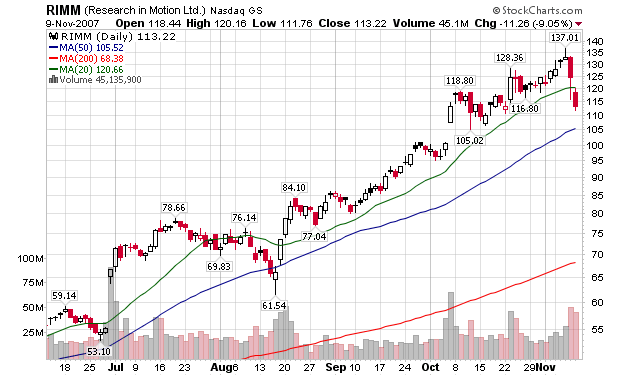
Research In Motion


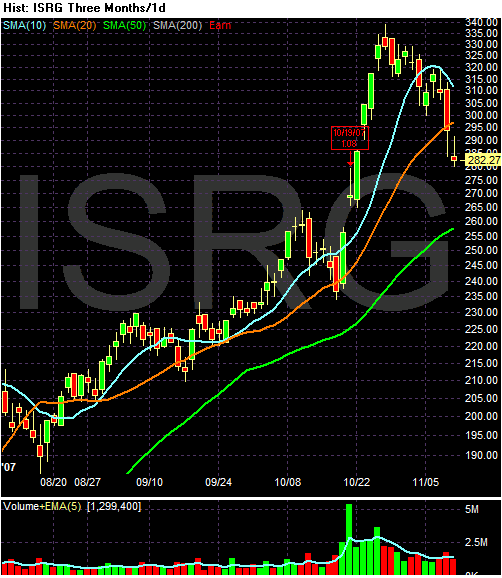
Intuitive Surgical


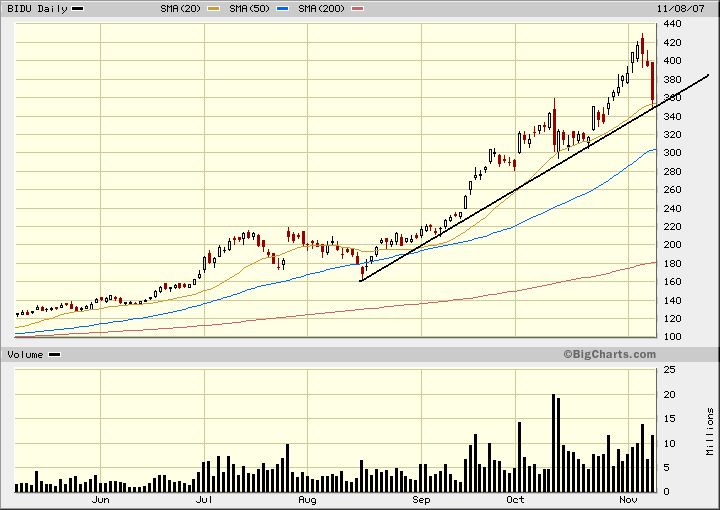
Bidu


Dry Ships


Amazon


Intel


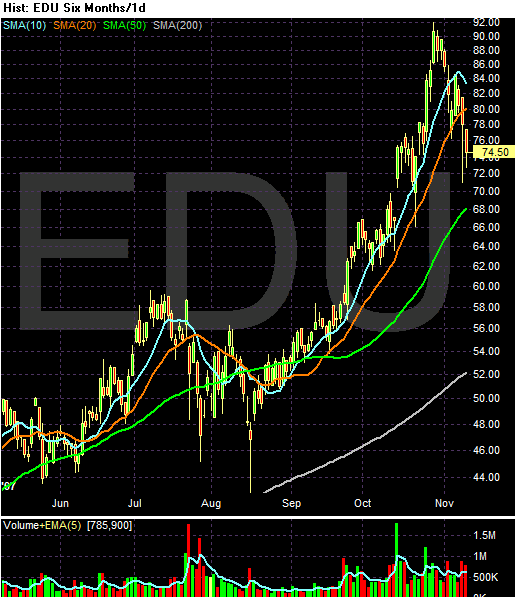
New Oriental Education


In other words, the fewer and fewer stocks that were leading the markets higher took hits last week. Considering some traders probably have big profits in these stocks, they may want to book those profits in the face of market weakness.

The SPYs and QQQQs look terrible.


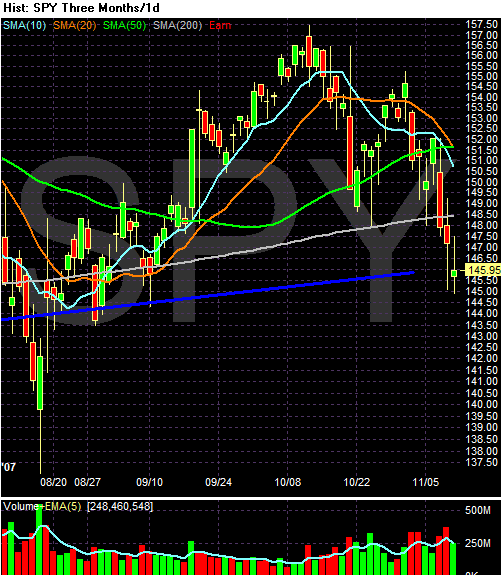
The SPYs are now below the 200 day simple moving average. Last week they sold-off on heavy volume.


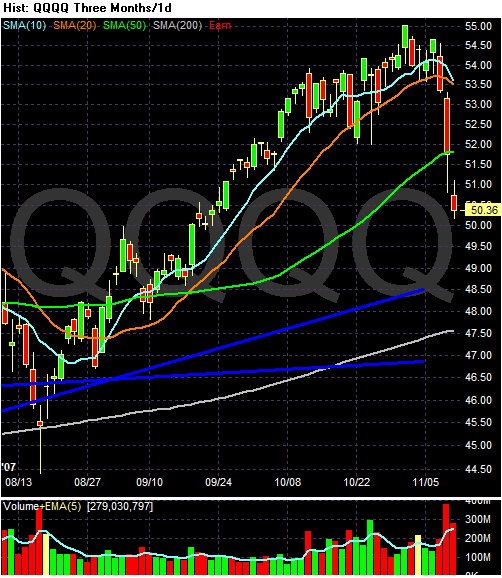
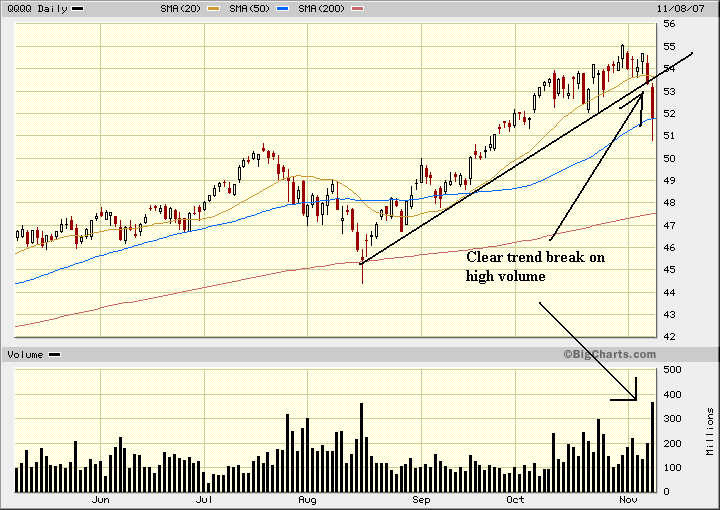
The QQQQs - the market darlings for the last few months -- have broken their uptrend. They broke through three SMAs last week on heavy volume.

The bottom line is the technical picture is terrible at best.

1.) We had three days of negative trading ending in a high-volume sell-off,

2.) The SPYs are below their 200 day SMA,

3.) The QQQQs broke their uptrend,

4.) Breadth is negative across the board, and

5.) The market's fewer and fewer strong stocks all took hits last week that broke their uptrends.

6.) There is also the further complication of the CDO/mortgage issue. It's quite possible that before the week is over we'll see more write-down of mortgage portfolios.

On top of that, there is little technical reason for the markets to rally, except, "the markets have sold off so we should nibble at some shares," or in practical parlance, "the technical bounce".

This is not the week to go long on anything. In addition, I would not be surprised to see a further sell-off.

There are four saving graces this week.

1 and 2. PPI and CPI are released this week. I would expect the markets to rally on a good (low) number because that would indicate the Fed has room to lower rates. (Conversely, a spike in either of these numbers could lead to a sell-off because it would lower the possibility of a rate cut.)

3. On the good side (referencing the long-term charts), the SPYs could fall another approximately 5.5% and still maintain their long-term rally. With the QQQQs, that number is 5.6%. That margin gives traders a lot of leeway in making trading decisions.

4. The ever classic random event that no one can plan for.

Transports Break Support


For those who subscribe to Dow theory, this is a very bad sign for the market.

Last Week's Market Action

Here are the charts for the SPY, QQQQ and IWM. Commentary is below


Note the following.

1.) All three averages dropped hard on Wednesday and Thursday. The biggest loser in this sell-off was the QQQQ which was holding onto technical support around 53.5.

2.) All three averages gapped down on Friday.

3.) All three averages had heavy, end-of-day selling on Friday.

What does all of this tell us?

1.) The sell-off was not limited to a particular sector of the market. Assume the SPYs represent more established blue chip companies, the QQQQs represent technology and the IWMs represent small-cap, aggressive growth. Given this assumption traders sold positions in everything. This wasn't one company in a sector reporting bad news and then the sector selling off in sympathy with that report.

2.) The end-of-the day selling on a Friday indicates traders are very nervous about the markets; no one wanted to hold anything over the weekend. If that mentality has not changed then traders could be trigger happy going into the week.

3.) We had two consistent down days (Wednesday and Thursday) followed by a gap down on Friday with heavy end-of-the day selling. That gives us three days of bearish sentiment.

Short version: there is a ton of bearishness and nervousness going into this week.

We have two big news items this week: PPI on Wednesday and CPI on Thursday. These will be very important items because they directly influence Fed policy. A weak number will spur Fed rate cut assumptions and a strong number will do the opposite.

Saturday, November 10, 2007

One of the Stupidest, Dumbest, Most Moronic Ideas of the Year


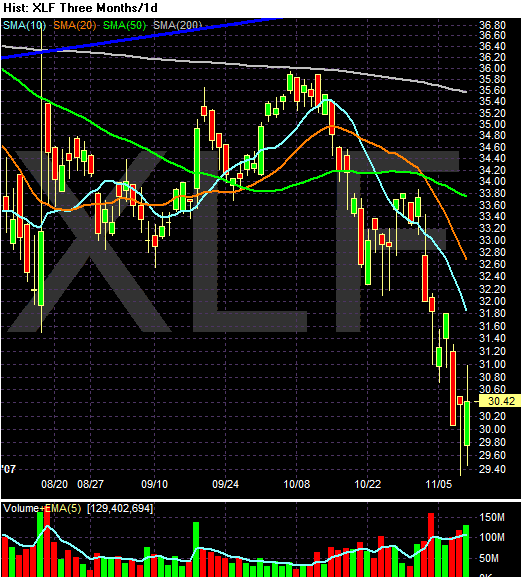
Financial stocks rallied yesterday, as evidenced by the strong green bar and heavy volume. The reason? Bottom fishing. But I will once again warn anybody that is thinking financial stocks are cheap right now: buying into the financial sector right now is stupid, moronic and perhaps one of the dumbest ideas I have ever heard.

And I am not alone:

Back around 2000, when the cracks first appeared in the big-cap technology shares that had been the source of great fanfare for quite a time, one of the popular views that surfaced was that these stocks — after enduring a harsh selloff — were cheap simply because they had fallen so far from their previously lofty heights. Of course, that proved to be a fool’s game.

This phenomena has resurfaced, somewhat disconcertingly, with the financial sector, as the sharp falloffs in the names everybody knows — Citigroup, Merrill Lynch, Washington Mutual — has produced some sniffing around simply because the stocks are off as far as they are. Banks may indeed be cheap. But they’re not cheap because of where they were a month ago.

A number of commentators have mentioned the idea of getting into the banking stocks now based on the sharp pullback, but with certain reservations. “People with a longer-time horizon and higher risk tolerance might want to start looking at some of these banks,” says James Simos, managing principal at Infinity Securities, noting the declines in the financials.


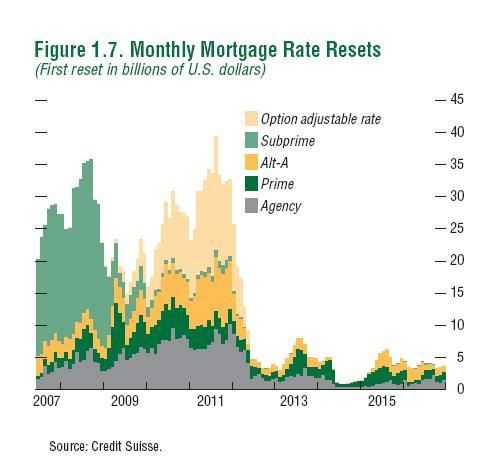
This chart -- which shows the number of resets we have in the next three years and is from the International Monetary Fund -- indicates we're just getting started:


Anyone going long in financial stocks right now -- and anyone offering the advice -- is going to lose people a lot of money.

More Thoughts on the Russell 2000


First, reference the IWM chart below. Notice the Russell 2000 has been in an upswing for the last 4 years. However, on its latest up-swing it failed to rally to the upper trendline. Instead, it missed that line by a few points.

The chart above shows the possibility of the Russell 2000 forming a triangle consolidation pattern. Notice there are two possible lower trend lines. The upper line would indicate the Russel has already broken below key support. This analysis makes sense considering the Russell is already below its 4 year support line.

The second line is less certain. But it's important to remember that trend lines can move and multiple lines can exist. Therefore we have to consider it. However, I personally place less weight on this line largely because it is below the 4-year support line.

Some Long Term Perspective

After big sell-offs, its usually a good idea to take a look at the long-term market perspective to see exactly where we are in the market cycle.

Also a note about my charts. I'm playing with different chart formats. After reading Tim Knight's blog Slope of Hope I'm trying out a longer chart using log scale. I'm not sure if I will continue to use it, but it does seem to show price movements in a clearer way.


The SPYs were in a three year uptrend which they broke out of in late 2006. They have rallied from previous resistance levels twice. There are two ways to look at the two tops formed in 2007. One is as part of an increasing highs/increasing lows rallying formation. The other is as a double top. The highs are within two points of each other, so a double top seems the more likely explanation; the second top isn't meaningfully higher than the first.


Like the SPYs, the QQQQs were in the middle of a three year uptrend starting in 2004. However, starting in mid-2006, the QQQQs went into another pattern -- an upward sloping rally. They are still in the middle of this rally; in fact, the QQQQs have two levels of long-term support. The first is the upper range of the 2004-2007 rally. The second is the support of the upward sloping rally that started in 2006.


The Russel 2000 is at the lower end of a four year uptrend. This is a crucial market to watch over the next few weeks. The Russell 2000 is an index of small cap stocks. As such, it's appropriate to consider this index a measure of traders overall risk appetite. In addition, the index is currently testing the lows of its three year upward move. A decisive move below support would signal a change in traders risk appetite. In other words, in a more pronounced market correction the first stocks to get hit are the riskiest. This is what the Russell 2000 tracks.

Friday, November 9, 2007

Weekend Weimar

Traffic has increased this week, which I am guessing is part of the market turmoil we have been experiencing this week. So to my new readers, welcome to "Weekend Weimar". I have two -- Kate and Sarg -- who are great dogs. This is a great breed, full of personality and spirit. I like them best because they have strong issues with authority (I have no idea why I like that...)

When you see these pictures, you know the following.

1.) The markets are closed.

2.) It's time to take a break.

I will post more charts and graphs on the market tomorrow and Sunday. But for now, take a break. Take a walk, go running, read a book, play guitar, watch a movie, or do anything except think about the economy and the markets.

What Inflation?

From the BLS:

The U.S. Import Price Index advanced 1.8 percent in October, the Bureau of Labor Statistics of the U.S. Department of Labor reported today, led by a 6.9 percent rise in petroleum prices. The increase followed a 0.8 percent advance in September. Prices for U.S. exports rose 0.9 percent in October after a 0.3 percent increase the previous month.

....
The 1.8 percent rise in import prices in October was the largest monthly increase since a similar change in May 2006. The advance followed a 0.8 percent rise in September as the increase during the past two months continued the upward trend over most of 2007 after a 0.4 percent downturn in August. The 6.9 percent increase in petroleum prices was the largest contributor to the October increase, although nonpetroleum prices also advanced, rising 0.5 percent. Petroleum prices continued an upward trend over the past year, rising 41.4 percent for the 12 months ended in October. The increase in nonpetroleum prices in October followed a 0.2 percent decline in September. Nonpetroleum prices advanced 3.2 percent over the past year while the price index for overall imports rose 9.6 percent for the same period.


Here's how the Federal Reserve reads this statement:


The U.S. Import Price Index advanced 1.8 percent in October, the Bureau of Labor Statistics of the U.S. Department of Labor reported today, led by a 6.9 percent rise in petroleum prices. The increase followed a 0.8 percent advance in September. Prices for U.S. exports rose 0.9 percent in October after a 0.3 percent increase the previous month.

....
The 1.8 percent rise in import prices in October was the largest monthly increase since a similar change in May 2006. The advance followed a 0.8 percent rise in September as the increase during the past two months continued the upward trend over most of 2007 after a 0.4 percent downturn in August. The 6.9 percent increase in petroleum prices was the largest contributor to the October increase, although nonpetroleum prices also advanced, rising 0.5 percent. Petroleum prices continued an upward trend over the past year, rising 41.4 percent for the 12 months ended in October. The increase in nonpetroleum prices in October followed a 0.2 percent decline in September. Nonpetroleum prices advanced 3.2 percent over the past year while the price index for overall imports rose 9.6 percent for the same period.


Wasn't that easy? All of the bad news is gone.

Get Ready For More Downgrades

From the WSJ:

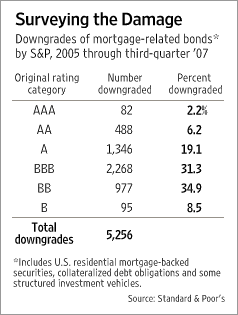
In the next few weeks, debt-rating services like Moody's Investors Service, Standard & Poor's and Fitch Ratings look poised to downgrade hundreds of mortgage-related investments worth tens of billions of dollars, creating the potential for more market unrest.

....
Credit-rating firms have lowered their credit ratings on more than $70 billion in mortgage-related bonds in the past few months, setting off waves of distress in the stock and bond markets. They've also expressed concerns about the outlook for a range of related industries from banking to bond insurance. Banks and Wall Street firms including Citigroup Inc. and Merrill Lynch & Co. took large charges when they were forced to reassess the value of even their highest-rated mortgage debt.

The article also has this very revealing graphic about the breadth of the writedowns:


This is going to get really ugly and confusing for money managers over the next year or so as they figure out what they can and can't invest in.

Thursday, November 8, 2007

A Closer Look At the Financial Sector

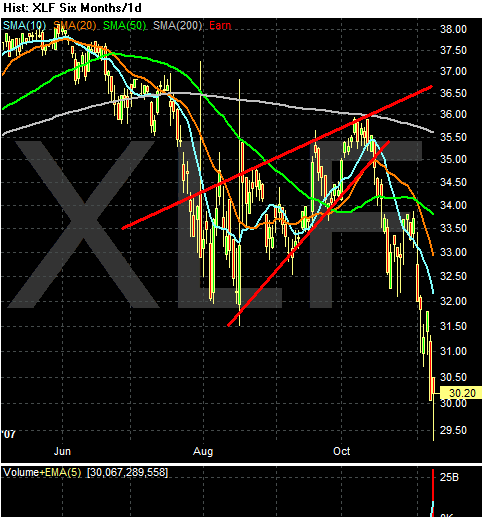
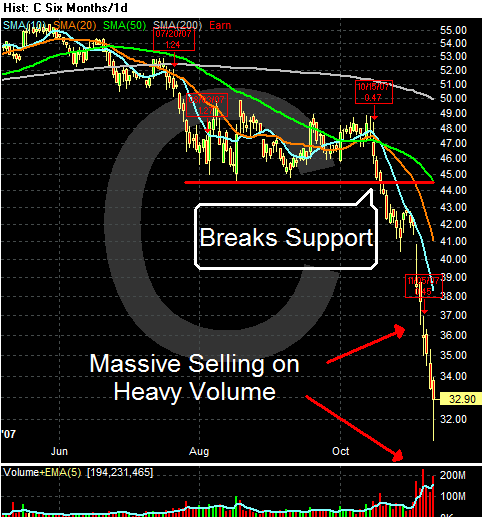
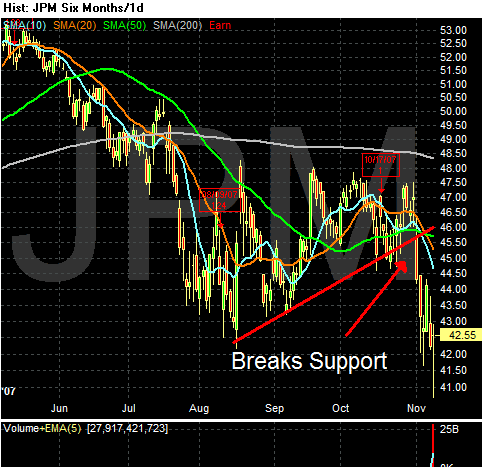
About a month ago I looked at the various sectors withing the financial sector. In light of yesterday's bank inspired rally, I want to look at the XLF and its largest components.

Here is what got me thinking about this sector:

``More people are going to start nibbling in the financials because they've been in a bear market more or less for the last six months,'' said Joseph Quinlan, chief market strategist for Bank of America Corp.'s Global Wealth & Investment Management unit, which oversees $710 billion. ``The correction has been severe enough that now we've gotten buyers back into the market.''


The XLF


Citigroup


JP Morgan


Wells Fargo


Bank of America


AIG


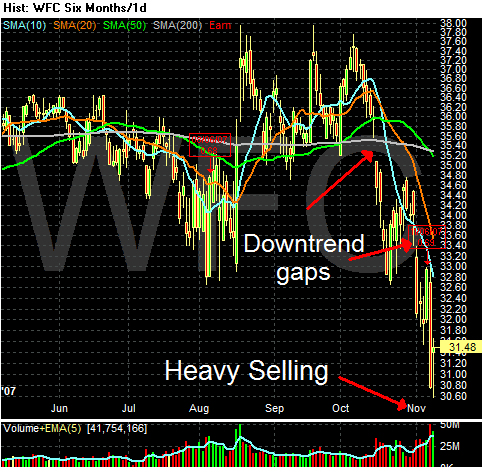
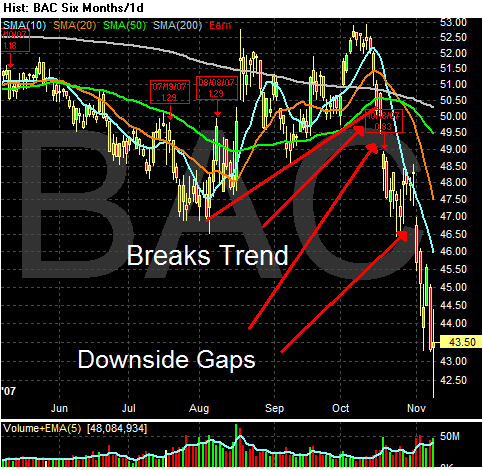
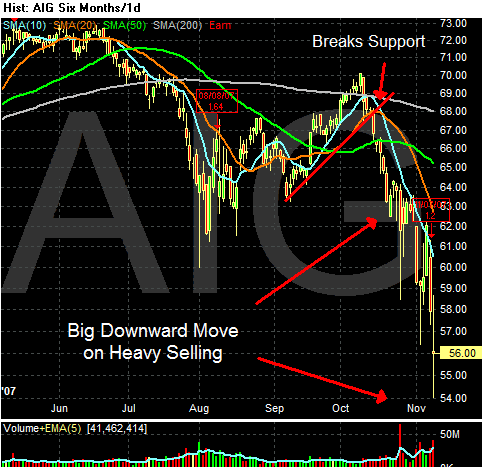
My commentary to all the charts is the same.

1.) All are below the 200 day simple moving average (SMA). This is bear market territory.

2.) All of their respective SMAs are moving lower.

3.) All of their respective prices are below their SMAs.

4.) All have recently broken key technical support.

5.) Most of their shorter SMAs are below longer term SMAs, indicating further downward price pressure.

6.) Some of the chart have downside price gaps, indicating extreme selling pressure.

The bottom line is simple: this sector says either sell me or stay the hell away. This is not the time to be buying financial shares in any way, shape or form.

Like Lemmings Off a Cliff....

From Bloomberg:

Most U.S. stocks rose after banks rallied in the final hour of trading from their lowest level in two years and food companies climbed on speculation their earnings growth will weather a slowing economy.

...

``All of a sudden these things are starting to get pretty cheap,''
said Wayne Wilbanks, who oversees $1.3 billion as chief investment officer of Wilbanks Smith & Thomas Asset Management LLC in Norfolk, Virginia. ``That's what was important about today. This was a good sign.''


Let's define cheap in a few ways.

1.) Cheap because it is overlooked.

2.) Cheap because it sucks.

Which category does the industry that today alone wrote down over $10 billion in debt fall into?

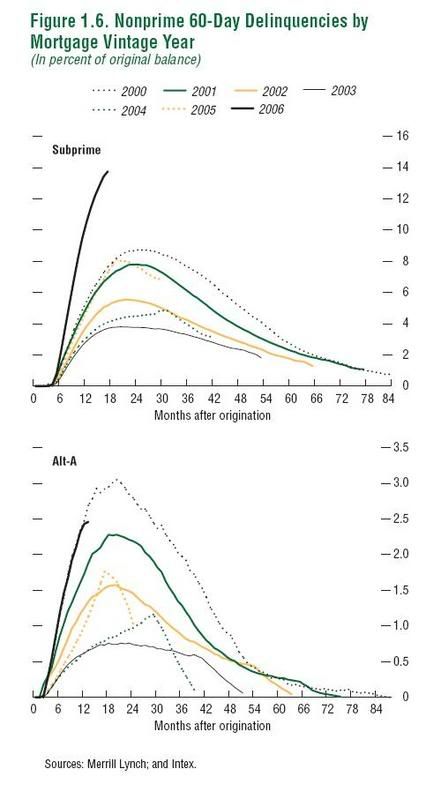
In case you're wondering, we're a few years off from the end of this problem


Then there's the whole delinquency thing....


Financials are cheap because they suck right now.

Today's Markets


I'm going to start with the QQQQ's daily chart, because this is where the real news of the day lies. For the last few weeks, tech has been the market's saving grace. That stopped today as trader's booked profits. The problem with the NASDAQ has been an ever decreasing breadth. Here are the breadth charts that I put up yesterday that show a decreasing level of participation from issues in the index.

Cumulative advance/decline line


New highs/new lows.


Today we saw some of the market leaders take big hits on high volume.

Apple:


Google:


Bidu


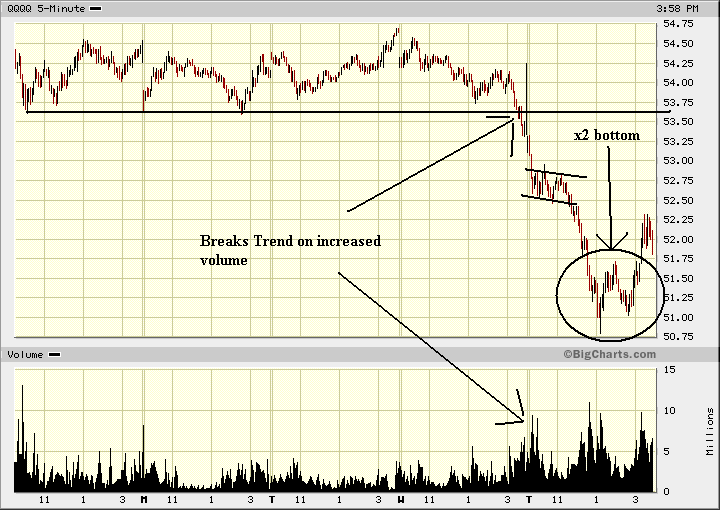
On the 5 day chart, the damage from today's sell-off is clear:


The QQQQs fell through support on heavy volume, formed a double bottom and then rallied. The end of the day rally looks to me like purely technical buying rather than fundamentally based purchases. That is, the index got cheap on a daily basis so traders came in and made some buys.


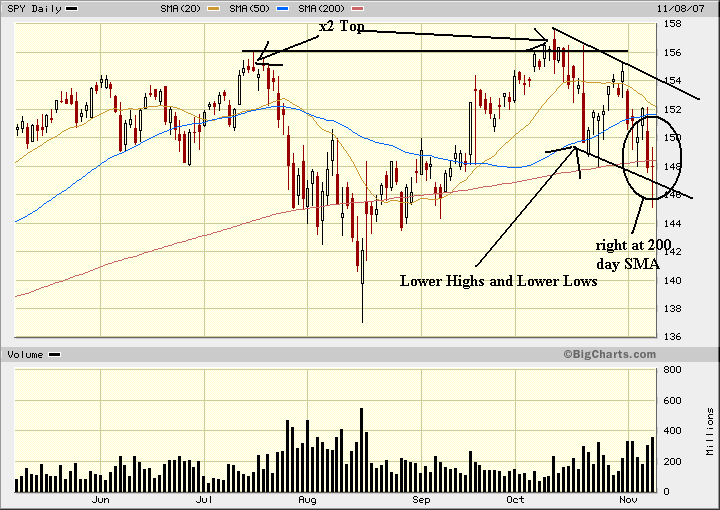
The daily SPYs are look more and more like they formed a double top and are in the middle of a correction with lower highs and lower lows. Also note that prices are sitting on the 200 day SMA.


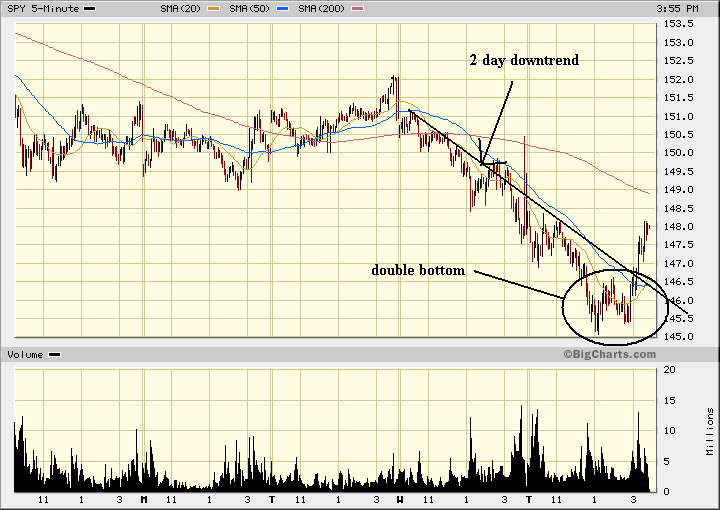
The 5-day SPYs show a clear two day downtrend leading to a double bottom followed by a technically based rally into the close.

Yesterday's action hit the SPYs hard. Today's action hit the QQQQs with the same degree of ferocity.

Bernanke's Statements

From the Federal Reserve:

Looking forward, however, the Committee did not see the recent growth performance as likely to be sustained in the near term. Financial conditions had improved somewhat after the September FOMC action, but the market for nonconforming mortgages remained significantly impaired, and survey information suggested that banks had tightened terms and standards for a range of credit products over recent months. In part because of the reduced availability of mortgage credit, the contraction in housing-related activity seemed likely to intensify. Indicators of overall consumer sentiment suggested that household spending would grow more slowly, a reading consistent with the expected effects of higher energy prices, tighter credit, and continuing weakness in housing. Most businesses appeared to enjoy relatively good access to credit, but heightened uncertainty about economic prospects could lead business spending to decelerate as well. Overall, the Committee expected that the growth of economic activity would slow noticeably in the fourth quarter from its third-quarter rate. Growth was seen as remaining sluggish during the first part of next year, then strengthening as the effects of tighter credit and the housing correction began to wane.


Put all of this in the "duh!!!" column.

The Committee also saw downside risks to this projection: One such risk was that financial market conditions would fail to improve or even worsen, causing credit conditions to become even more restrictive than expected. Another risk was that, in light of the problems in mortgage markets and the large inventories of unsold homes, house prices might weaken more than expected, which could further reduce consumers' willingness to spend and increase investors' concerns about mortgage credit.


Y'think, Ben? Existing home inventories are near their historical high by a wide margin, home vacancies are high, credit is tightening and the US consumer is already coping with an incredibly high debt load. All of those factors just might lead to further home price deterioration.

The Committee projected overall and core inflation to be in a range consistent with price stability next year. Supporting this view were modest improvements in core inflation over the course of the year, inflation expectations that appeared reasonably well anchored, and futures quotes suggesting that investors saw food and energy prices coming off their recent peaks next year. But the inflation outlook was also seen as subject to important upside risks. In particular, prices of crude oil and other commodities had increased sharply in recent weeks, and the foreign exchange value of the dollar had weakened. These factors were likely to increase overall inflation in the short run and, should inflation expectations become unmoored, had the potential to boost inflation in the longer run as well.


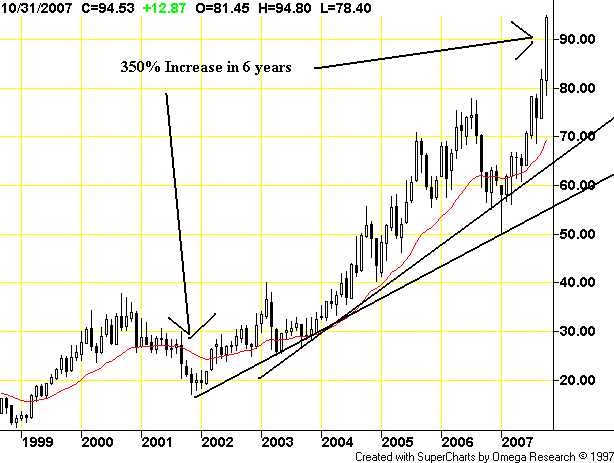
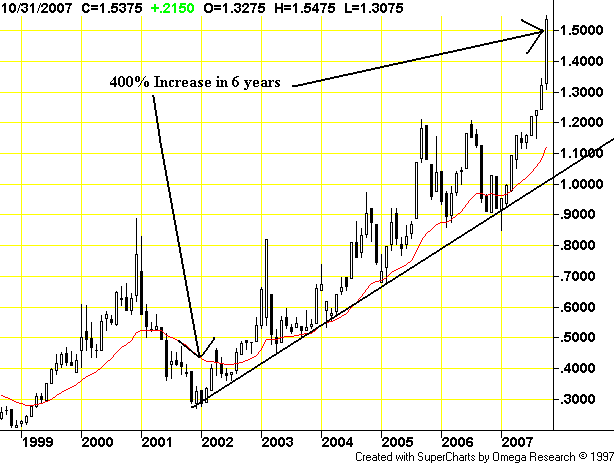
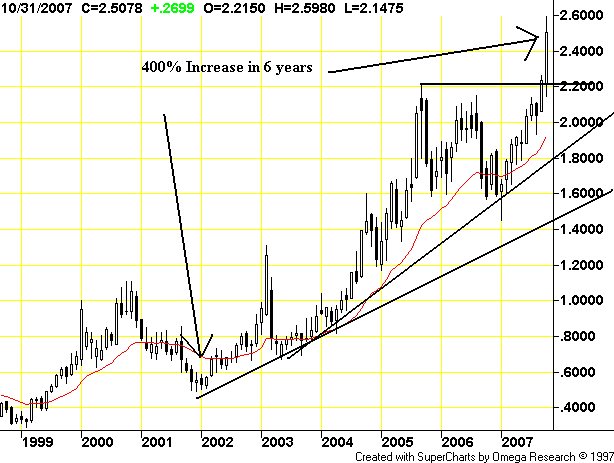
In case you were wondering, none of the following charts are important in any way shape or form, and they do not -- repeat DO NOT -- show any energy or agricultural price inflation in any way, shape or form. In fact -- just ignore the following chart, because the Federal Reserve does.

Corn


Wheat


Oats


Oil


Propane


Heating Oil