Monday, March 26, 2007

New Home Inventory in Perspective

This graph is from Interest rate roundup a great blog that everybody should read. Not only does it make me miss a Bloomberg terminal, it also shows just how out-of-whack the current inventory level is with historical norms.

I resized the chart. It goes back to 1963.
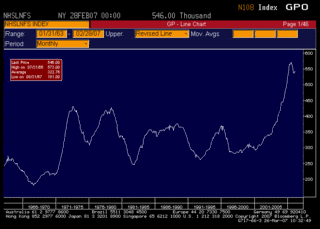
Photo Sharing and Video Hosting at Photobucket

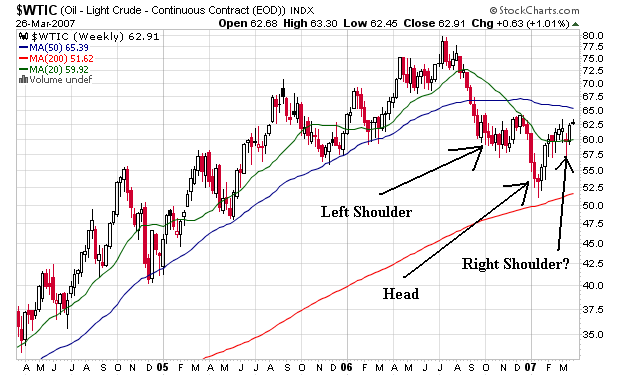
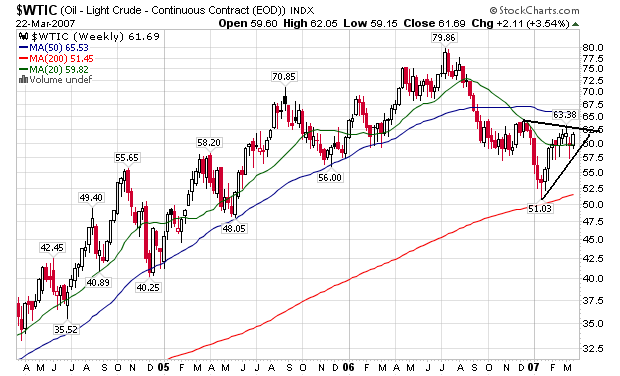
Is the Oil Weekly Chart Forming an Upside-Down Head and Shoulders Pattern?

Photo Sharing and Video Hosting at Photobucket


If it is, then the last 4-6 months have been a consolidation, and a move above the neckline would indicate a possible bull run --- just in time for the summer driving season.

Food for thought....

Oil Prices Set Yearly High

From Yahoo News:

Oil prices settled Monday at their highest level so far this year on tensions between Iran and the West following Tehran's detention of British naval personnel. Gasoline futures prices climbed above $2 a gallon to their highest level since last September as a new driving season nears.

Oil traders worried that an escalation in the conflict could cut Persian Gulf oil exports.

On the New York Mercantile Exchange, light, sweet crude for May delivery rose 63 cents to settle at $62.91 a barrel, the highest settlement for the front-month contract since Dec. 20. Earlier, the contract rose as high as $63.30 a barrel.
Oh to be a Central Banker now that inflationary pressures are increasing during an economic slowdown....

Markets Stage an Impressive Rally

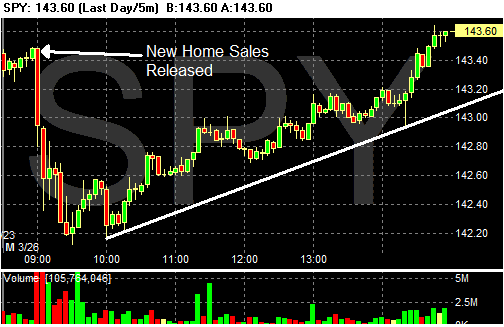
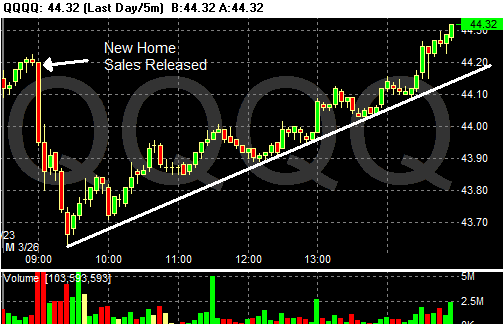
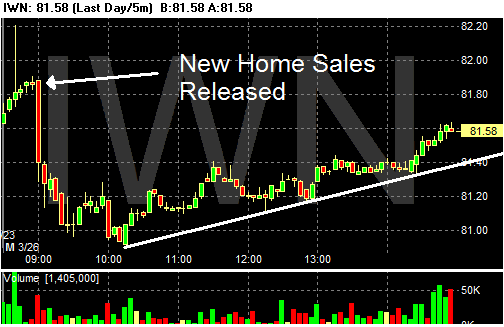
The charts say it all. The SPYs, QQQQs and IWNs all tanked after the new home sales reports. But all three staged an impressive recovery throughout the rest of the day. All three have what is called a "bump and run" formation, meaning all three markets had an upward sloping trend line which acted as support for the entire rally.

In addition, the SPYs and QQQQs all closed at/near their daily highs on a good volume spike.

This was a solid bull-based performance for the averages. In conjunction with last week's performance, it looks like the bulls are in charge -- at least for now.

Photo Sharing and Video Hosting at Photobucket

Photo Sharing and Video Hosting at Photobucket

Photo Sharing and Video Hosting at Photobucket

More on New Home Sales

Welcome to Taylor Marsh Readers

Welcome to the Left Coaster Readers

From Bloomberg:

The supply of unsold homes climbed to the highest in 16 years, the Commerce Department said in Washington today. Purchases dropped 3.9 percent to an annual pace of 848,000 last month. Economists had forecast they would rise to a 985,000 rate, based on the median forecast in a Bloomberg News survey.

.....

``As ugly as these numbers are, they don't reflect the tightening of lending standards, which means sales are going to get worse,'' said Christopher Low, chief economist at FTN Financial in New York. ``The longer it takes for housing to recover, the more the risk it could spill over to other parts of the economy.''


From CBS:

Inventories of unsold homes rose 1.5% to 546,000, representing an 8.1-month supply, the largest inventory in relation to sales since January 1991, at the tail end of a recession. The inventory is up 27% in the past 12 months.

Inventories are probably understated, however, because they don't include homes thrown back on the market due to buyer cancellations

Record backlogs

The number of completed but unsold homes rose to a record 179,000 in February from 177,000, up 43% from a year earlier.

"There is an enormous backlog of unsold new homes that have to be worked off before builders will start building spec homes," wrote Ray Stone, chief economist for Stone & McCarthy Research, in a research note.

Let's review the points made above.

1.) Sales are at the lowest level in 7 years

2.) Inventories are the highest they've been in 16 years -- at the tale end of a recession.

3.) Inventories are probably higher because of cancellations.

4.) Tighter lending standards -- which have been recently implemented -- aren't included in these numbers.,

5.) The number of completed and unsold homes is at a record.

None of this news points to a bottom in housing. We're not even close.

New Home Sales Drop 3.9%

Welcome to Atrios Readers.

For more information -- and some great graphs -- see Calculated Risk

First -- this report has an incredibly large confidence interval. That simply means the actual number could be plus or minus 17.4.

The information is from the Census Bureau

Sales are down 18.3% from February of last year.

There is now an 8.1 month supply of available inventory. That's a ton of homes.

The total raw inventory level has increased from 538,000 in February 2006 to 546,000 in February 2007. Remember we saw housing starts increase 9% in February. That means we've got more inventory coming onto the market. My guess is the homebuilders were expecting demand to pick-up a bit this year. These recent starts could mean the market may build an unwanted inventory glut.

The Northest and Midwest saw big drops -- 27% and 20%, respectively. The weather will be blamed for some of this. The West saw a 24.6% increase. That number doesn't make sense. I am guessing we'll see a revision of that number or the January number sometime soon.

Also remember that lending standards have tightened over the last few months. That means there will be fewer buyers going forward.

Also -- the median price increased from 243,200 to 250,000. It doesn't make sense for prices to increase in a decreasing sales market.

The bottom line is this report stinks for the housing market.

Dollar Update

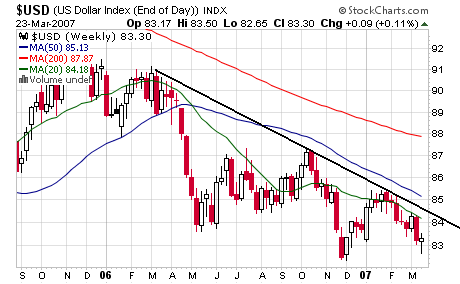
The weekly dollar chart still shows the dollar is in a bearish pattern of lower lows and lower highs. Also note

1.) The trend line is still decidedly downward and the dollar index is nowhere near breaking the trend.

2.) The 20/50/200 SMAs are all decidedly bearish as well.

It's going to take a big, fundamental change for this chart to move into bullish territory.

Photo Sharing and Video Hosting at Photobucket

Foreclosures Still Increasing

From Bloomberg:

U.S. homeowners are falling behind on their payments 33 percent faster than they did last year, according to a report by California-based RealtyTrac, which researches data on Americans entering the foreclosure process.

In February, foreclosure proceedings -- from default notices for late payment to auctions and repossessions -- rose 12 percent from a year earlier, affecting 130,786 properties, or one in every 884 U.S. households, RealtyTrac said.

Falling or little-changed home prices are making it difficult for homeowners to sell or get new mortgages on homes they bought or refinanced with adjustable-rate mortgages.


It's important to note that we're still in an economic expansion, albeit a slower one. That means if we hit a recession, we're in for some scarier numbers.

OPEC Production Cuts Reduce Output By 1 Million Barrels/Day

From Bloomberg:

Saudi Arabia is shipping less oil to customers. OPEC by February reduced daily output by 1 million barrels. Global inventories this year fell the most in a decade.

Credit Ali al-Naimi, oil minister of Saudi Arabia, the world's largest exporter, who told OPEC members that production cuts would stop a six-month decline in oil. Crude this year rebounded 26 percent from a 20-month low to $62.81 a barrel.

``We are happy with the level of compliance,'' Mohamed al- Hamli, president of the Organization of Petroleum Exporting Countries, said in an interview in Bangkok on March 22.


Oil has bounced around between roughly $57 - $62/barrel for the last few months. OPEC's production cuts should help to provide a floor for prices going forward.

The decline in inventories is also providing a floor for oil prices.

This is not good news for the Federal Reserve who are caught between stubbornly persistent inflationary pressures (in part caused by commodity prices) and slower growth.

A Quick Review of Last Week

From IBD:

The Nasdaq ramped up 3.2% for the week. That was the tech-laden composite's best return since a 3.2% surge during the week ended Sept. 15 of last year.

The S&P 500 bounced 3.5% for the week. The Dow leapt 3.1%, while the S&P 600 vaulted 4.1%

Here's a link to the charts.

Sunday, March 25, 2007

Agricultural Prices Still At Dangerous Levels

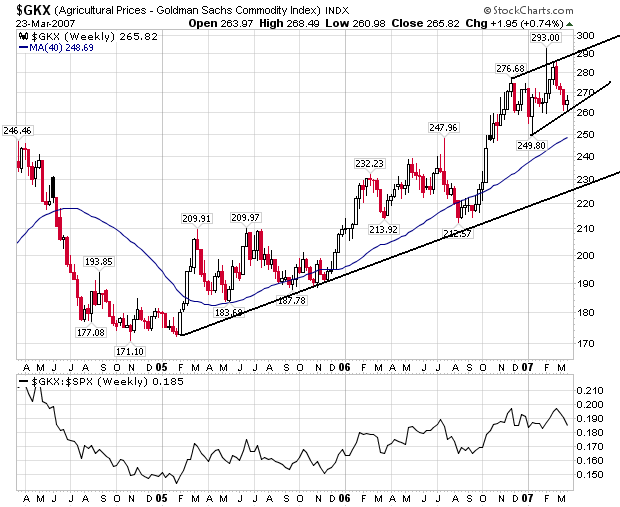
Here is a chart of agricultural futures. Remember that in both CPI and PPI, agricultural prices have been spiking for the last three months. In conjunction with oil prices, these price increases may be large enough to keep the Federal Reserve on hold for an interest rate cut unless the economy really tanks.

Photo Sharing and Video Hosting at Photobucket

Oil Prices Making a Comeback

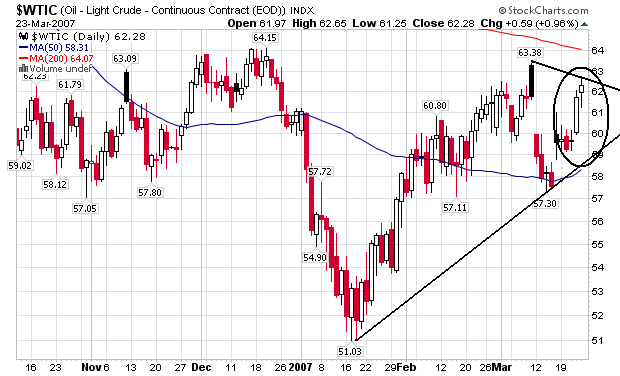
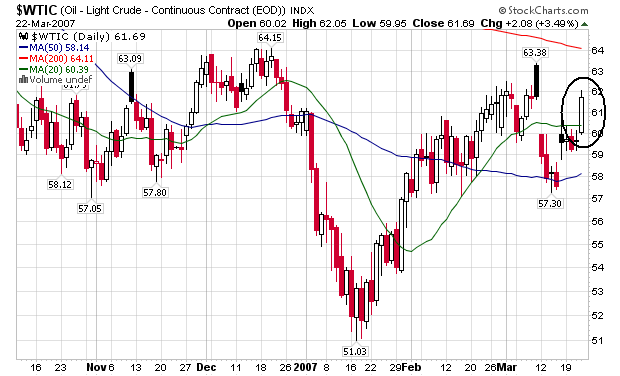
Here is a daily chart of oil prices:

Photo Sharing and Video Hosting at Photobucket

Last week's price action is circled. Notice the big jump in prices after the Iranians captured 15 British sailors. Oil's sensitivity to geopolitical issues will continue to be a huge Achilles heal.

The Week Ahead

New home sales come out on Monday. Pay particular attention to the inventory levels -- especially the raw numbers. The total available inventory increased 2.68% from January 2006 - 2007, from 522,000 to 536,000. It's going to be awhile before the big drop in new home construction starts to decrease this inventory.

Bernanke speaks on Wednesday and Friday. Pay very close attention to what he says about inflation. His speeches are available online at the Federal Reserve site.

The final 4th quarter GDP number comes out on Thursday. So long as the number doesn't jump around this won't be that important.

We also get durable goods and NAPM numbers on Wednesday and Friday, respectively.

Saturday, March 24, 2007

Saturday = Day Off

Going to a local art festival with my girlfriend. She's the only person who can get me away from the markets.

Back sometime tomorrow.

Friday, March 23, 2007

The Market's Last Week

Let's take a look at the charts to see what happened last week

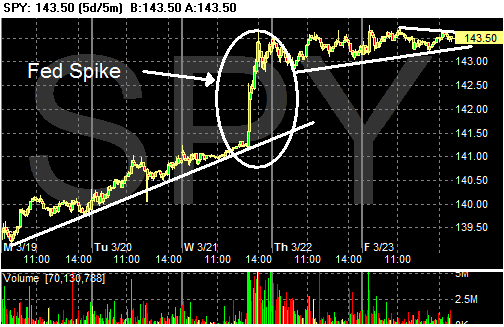
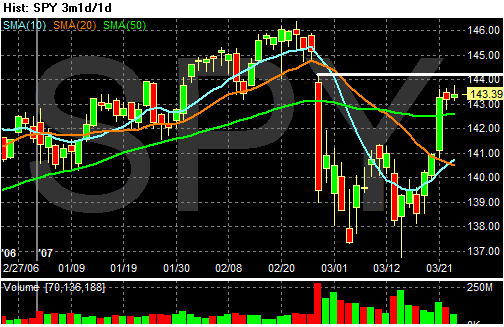
The SPYS had a nice upward bias through mid-Wednesday. They spiked after the Fed announcement then consolidated for the rest of the week.

Photo Sharing and Video Hosting at Photobucket

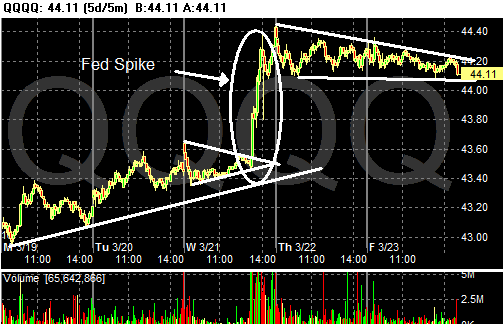
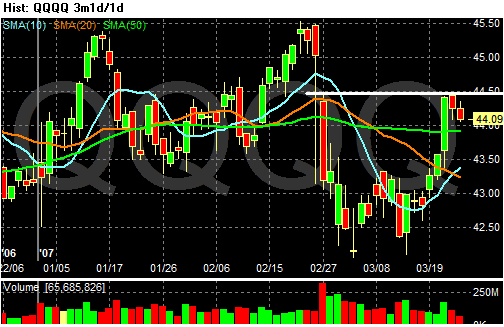
The QQQQs rose a a bit until mid-Tuesday when they consolidated their gains. Then they spiked after the Fed announcement and consolidated for the rest of the week.

Photo Sharing and Video Hosting at Photobucket

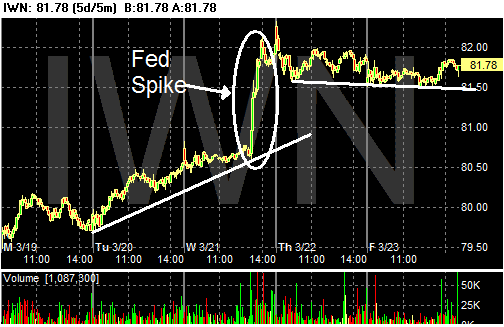
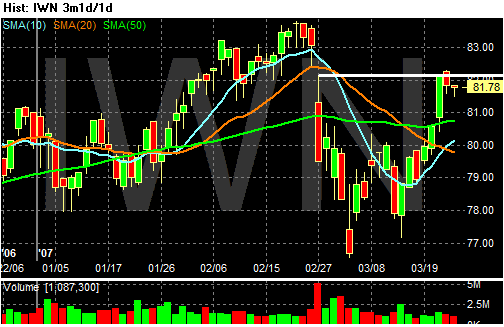
The IWNs rallied from Tuesday morning until the Fed announcement, then rallied hard on the rate announcement. Like the other two averages, they consolidated gains for the rest of the week.

Photo Sharing and Video Hosting at Photobucket

All three charts are solid charts going forward -- all three have strong upward momentum.

Looking at all three charts from the daily perspective, all three closed the week out below important resistance levels. If the markets want to continue higher they will have to cross and cloase above these levels.

Photo Sharing and Video Hosting at Photobucket

Photo Sharing and Video Hosting at Photobucket

Photo Sharing and Video Hosting at Photobucket

Existing Home Sales Increase Most in three Years

From Bloomberg:

Sales of previously owned homes in the U.S. unexpectedly rose in February at the fastest pace in three years, a sign the housing market is still recovering even as lending standards tighten.

Purchases increased 3.9 percent last month to an annual rate of 6.69 million, from 6.44 million in January, the National Association of Realtors said today in Washington. Sales were down 3.6 percent from a year earlier.

The report, together with a gain in February housing starts reported this week, bolsters the view that housing will gradually stop being a drag on economic growth. Falling prices and low borrowing costs are supporting demand, easing concern that defaults on subprime mortgages will worsen the glut of homes, economists said.


Steady interest rates were a reason for the increase:

According to Freddie Mac, the national average commitment rate for a 30-year, conventional, fixed-rate mortgage was 6.16 percent in the last week, down from an average of 6.29 percent in February. The 30-year fixed was 6.22 percent in January, and 6.25 percent in February 2006.


OK -- now the bad news:

The national median existing-home price2 for all housing types was $212,800 in February, down 1.3 percent from February 2006 when the median was $215,700. The median is a typical market price where half of the homes sold for more and half sold for less.

...

Total housing inventory levels rose 5.9 percent at the end of February to 3.75 million existing homes available for sale, which represents a 6.7-month supply at the current sales pace compared with a 6.6-month supply in January. Raw inventories peaked last July at 3.86 million, and supplies topped at 7.4 months in October.


To sum up, sales increased because prices are dropping. But inventory levels are still increasing. Also note that from a raw, total numbers perspective, the total number of existing homes on the market has only dropped 2.84% since July of last year. That means sales haven't really made a huge dent in the inventory on the market. While the market is never "cleared", it should come down a bit more than it has.

Going forward prices will probably have to drop more to clear the market.

How Widespread are Subprime Problems?

Pretty far. From the WSJ (subscription required):

Far from being limited to the subprime market, the data show these risky loan features have become widespread. According to Credit Suisse, the number of no or low documentation loans -- so-called "liar loans" -- has increased to 49% last year from 18% of purchase loans in 2001, a nearly three-fold increase. The investment bank also found that borrowers put up less than a 5% down payment in 46% of all home purchases last year. Inside Mortgage Finance estimates that nontraditional mortgages -- mostly interest-only and pay-option ARMs that allow the borrower to defer paying back principal or even increase the loan balance each month -- which barely existed five years ago, grew to close to a third of all mortgages last year.

The Alt-A market, a middle ground between subprime and prime, has increased seven-fold since 2001 and accounted for 20% of home-purchase loans last year. Fully 81% of Alt-A loans last year were no or low documentation loans, according to First American Loan Performance. Why have borrowers employed this kind of risky financing? Because it was the only way many of them could afford a home in some of the hottest housing markets, where prices more than doubled in five years.

Oil Prices Jump

From IBD:

Near-month oil futures shot up on fuel supply fear a day after gov't data showed another big drop in gasoline and heating oil stockpiles. The Fed's near-neutral bias Wed. raised hopes for stronger U.S. growth and energy demand. April RBOB gasoline rose 2.26 cents to $1.9575 a gallon, near Tues.' 7-month high. High gas prices could hit ailing U.S. consumers.


There's more:

Nationwide prices rose 1.8 cents last week to $2.577 a gallon. That's 7 cents higher than a year ago. U.S. gas prices have surged more than 36 cents in the past six weeks.

Demand was up while supplies of both gasoline and crude oil remained below year-ago levels.

Refineries are at capacity and gasoline imports are down. Gas futures are at their highest since August — suggesting retail prices have further to go.

"You put it all together and it's just very bullish for gasoline prices," said Phil Flynn, an energy analyst at Alaron Trading. "Don't expect these problems to go away."
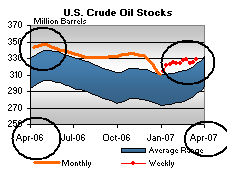
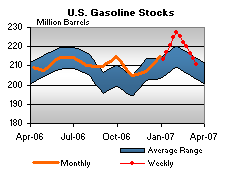
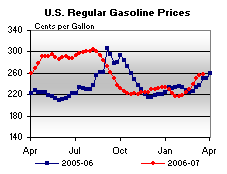
Here's why.

Oil inventories are lower now than they were at this time last year:

Photo Sharing and Video Hosting at Photobucket

And gas inventories are dropping fast and hard:

Photo Sharing and Video Hosting at Photobucket

As a result, gas prices are increasing:

Photo Sharing and Video Hosting at Photobucket

This is why the daily oil chart spiked yesterday:

Photo Sharing and Video Hosting at Photobucket

From a longer term perspective, oil prices appear to be consolidating in a triangle pattern:

Photo Sharing and Video Hosting at Photobucket

I bet the Federal Reserve is not happy about this development....

Some of these charts are from the Department of Energy's This Week in Petroleum

Thursday, March 22, 2007

Countrywide Executives Dumping Stock

From the Street:

Insiders at Countrywide, the nation's largest mortgage lender, have sold $314 million worth of shares in the company just since August. That's according to regulatory filings tracked by Interactive Data Corporation.

The sales include a staggering $94.5 million by chief executive Angelo Mozilo, and $17.5 million by mortgage division chief David Sambol.


That gives me a tremendous feeling of confidence.

Countrywide Financial: 2006 Defaults Could Set a Record

From CNBC:

"We believe that declining home prices and other factors ... may produce foreclosures numbers on 2006 originations approaching or exceeding those on loans originated in 2000," Samuels said in remarks.


Just what the housing market needed to hear....