If anything, the last four years have illustrated a very important point: conservatives don't know a damn thing about economics.
I've already demonstrated that John Hinderaker of Powerline is not clueless, but clue free -- he's never had any concept of how the economy works. Greg Mankiw of Harvard has shown that his ivory tower severely limits his analytical abilities and John Taylor continues to incorrectly compare this expansion to the 1980s expansion despite their highly divergent causes.
And now we're reminded that the calls for inflation and currency debasement from the Fed's bond buying program were horribly wrong:
A group of 43 economists, including former aides to Republican
presidents and presidential candidates, published an open letter to the
Fed’s chairman, Ben Bernanke, saying the program should be “reconsidered
and discontinued.” The planned bond purchases “risk currency debasement
and inflation, and we do not think they will achieve the Fed’s
objective of promoting employment,” the economists wrote.
.....
But as the accompanying charts indicate, the Fed’s critics of 2010 and
2011 have not proved to be prescient. Far from bringing disaster, Q.E.2
appears to have helped the economy.
And finally, over at Barry's blog, we note that the Heritage Foundation has a remarkably interesting way of scoring countries that are successful despite not using "free market" concepts. Read the entire piece: Where 7.8% Growth is “Moderate” and 4.4% is “Spectacular”
In a "market place of ideas" those that are proven correct should be "purchased" and those that are incorrect should be avoided, if for no other reason that incorrect analysis will lead to a loss of money. If you had listened to conservative economists "analysis" you'd have lost a ton of money by now.
Wednesday, July 3, 2013
Market/Economic Update: France
I'm less bearish on France, as some of the recent Markit and industrial production numbers could indicate the economy may pull out of its slump. But these positive numbers are of short duration, meaning we could simply be seeing an upward blip. We're in a, "trust, but verify" mode.
Let's start with GDP:
 The economy has contracted in three of the last four quarters. Aside from a .5% increase in 2Q12, PCEs have been weak. Investment has contracted for four straight quarters and exports have now dropped for two consecutive quarters. While the slowdown is not sharp, it is broad.
In addition, unemployment is still far too high. According to the Eurostat database, French unemployment is currently at 11%.
The latest Markit numbers are a bit more encouraging:
Latest data signalled an easing of the downturn in the French manufacturing sector during June. The headline Purchasing Managers’ Index® (PMI®) – a seasonally adjusted index designed to measure the performance of the manufacturing economy – registered 48.4, up from 46.4 in May. Although remaining below the 50.0 mark for a sixteenth consecutive month, the latest index reading was the highest in this sequence.
Here's a chart of the data:

The blue line is showing a fairly decent increase that is fast approaching the 50 level the separates expansion from contraction.
And an expansion may be possible from the latest IP numbers:
During the last three months (q-o-q), output increased in the manufacturing sector (+0.8%), as well as in industry as a whole (+0.9%).
Output improved in other manufacturing (+0.4%), in the manufacture of electrical and electronic equipment (+1.5%), in the manufacture of transport equipment (+2.0%). It rose in the manufacture of coke and refined petroleum products (+14.7%). On the contrary, output decreased in the manufacture of food products and beverages (-1.2%).
Here's a chart of the data:

The chart is a bit confusing, but we do see a bump in the overall composite numbers. However, the trend is still lower; we need to see additional numbers to conclude this is not a one month blip.
Let's turn to the daily chart:

After hitting a peak in late May, the market has moved lower, finding support at the 200 day EMA and the top Fib fan. We also see declining momentum and CMF.
If prices move through the 200 day EMA, there's plenty of technical support.
I don't think this chart is a shorting opportunity anymore, nor do I think it's a buying opportunity. The economic data is still too fresh with too small of a trail to make a move as of yet.
Let's start with GDP:

In addition, unemployment is still far too high. According to the Eurostat database, French unemployment is currently at 11%.
The latest Markit numbers are a bit more encouraging:
Latest data signalled an easing of the downturn in the French manufacturing sector during June. The headline Purchasing Managers’ Index® (PMI®) – a seasonally adjusted index designed to measure the performance of the manufacturing economy – registered 48.4, up from 46.4 in May. Although remaining below the 50.0 mark for a sixteenth consecutive month, the latest index reading was the highest in this sequence.
Here's a chart of the data:

The blue line is showing a fairly decent increase that is fast approaching the 50 level the separates expansion from contraction.
And an expansion may be possible from the latest IP numbers:
During the last three months (q-o-q), output increased in the manufacturing sector (+0.8%), as well as in industry as a whole (+0.9%).
Output improved in other manufacturing (+0.4%), in the manufacture of electrical and electronic equipment (+1.5%), in the manufacture of transport equipment (+2.0%). It rose in the manufacture of coke and refined petroleum products (+14.7%). On the contrary, output decreased in the manufacture of food products and beverages (-1.2%).
Here's a chart of the data:

The chart is a bit confusing, but we do see a bump in the overall composite numbers. However, the trend is still lower; we need to see additional numbers to conclude this is not a one month blip.
Let's turn to the daily chart:

After hitting a peak in late May, the market has moved lower, finding support at the 200 day EMA and the top Fib fan. We also see declining momentum and CMF.
If prices move through the 200 day EMA, there's plenty of technical support.
I don't think this chart is a shorting opportunity anymore, nor do I think it's a buying opportunity. The economic data is still too fresh with too small of a trail to make a move as of yet.


Tuesday, July 2, 2013
Consumer inflation for June likely up 0.4%
- by New Deal democrat
Since 1999, inflation ex-energy has run generally between 1% to 2.8% a year, or about 0.1% to 0.2% a month, rounded. Once we add in energy costs, CPI is much more volatile:

One of my big theses on this blog over the last few years has been that the impact of the "Oil choke collar" on consumers explains a lot of the economy, especially with wages rising between 1.5% to 2% a year. In other words, with that low growth in wages, there is a big difference in the ability of consumers to save and spend based on an inflation rate under +1.5% and one over +2.0.
So I have taken to testing this hypothesis by making predictions about consumer inflation each month, to show how big a role the price of gasoline plays. Well, June is over, and we now know the average cost for gasoline for the month. Although the price of gas declined significantly in the last week, since the report will be issued today (i.e., in July), I do not believe it will be considered in the calculations of June's CPI. Escluding it, gasoline prices rose only $.01 in June, having averaged-$3.62 in June vs. $3.61 in May, an increase of only 0.3%. Here's a graph for the last twelve months including yesterday's report to put this in perspective
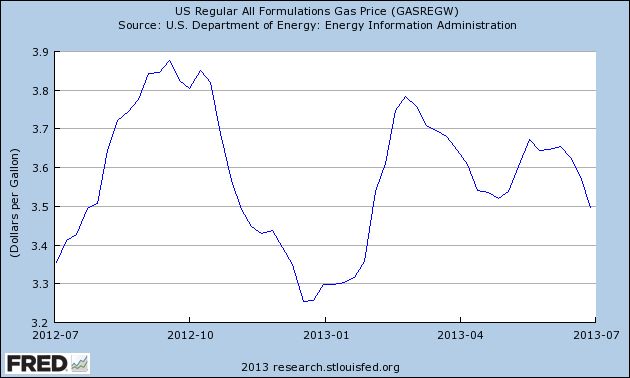
To arrive at an estimate of inflation, we divide this by 10, which gives us less than even 1/10 of a percent of inflation, or 0.03%. The non-seasonally adjusted inflation number will probably add 0.1% to that. Finally, per the below graph, you can see that in June between 0.2% to 0.3% is added for the seasonal adjustment, as seen in the June 2012 entry in the graph below of seasonally adjusted vs. non-seasonally adjusted consumer prices for the last year:

That suggests that consumer inflation for June is going to be reported at +0.4% +/-0.1%. This would bring YoY CPI up to 1.8%.
While that will bring about stories about how inflation is coming back, it is unlikely to be sustained in the third quarter. Last year saw a surprise spike in the price of gas from $3.25 to $3.90 from July through September. Unless that gets repeated, the monthly CPI readings of +0.5% and +0.5% in August and September (seasonally adjusted) are not going to be repeated, and YoY CPI is going to subside back towards +1.0%.
98/99 Price Level Still Providing Upside Resistance For Oil
This is probably some of the best news out there, as an oil price spike could send the weak recovery into a one quarter contraction:


Monday, July 1, 2013
Don't Expect a Bond Market Rout
We've now had a few weeks to digest the Fed's statement that they were thinking of removing the QE program. Let's take a step back and get an idea for what has happened.
The biggest move has come in the fixed income markets. As the FT has noted, we've seen a huge sell-off in bonds from both central banks and investors at large:
Holdings of US Treasuries held at the Fed on behalf of official foreign institutions dropped a record $32.4bn to $2.93tn, eclipsing the prior mark of $24bn in August 2007. It was the third week of outflows in the past four.
Private investors are also dumping fixed income. Bond funds tracked by EPFR Global, a data provider, saw total redemptions of $23.3bn in the week to June 26. US funds were the worst hit, with withdrawals totalling $10.6bn, but emerging market debt funds also saw record redemptions of $5.6bn.
This is to be expected as the Fed has essentially placed a permanent floor in the bond market for the last three years. At the same time, it's important to ask if the sell-off is overdone. First, the Fed hasn't started to taper yet. And a careful reading of their statement indicates that they may not even do it if the economy slows too much. Read in light of last week's downgrade of US growth for the first quarter, it's entirely likely that the Fed's plans may already be put on hold. Also remember the Fed will continue to reinvest principal payments as they come due.
At the same time, let's also remember that Treasury rates are at historic lows, as shown on this chart from the St. Louis Fed:

Since the beginning of the 1980, we've had a permanent rally in the fixed income market, essentially taking rates as low as they can conceivable go. So, at some point, we have to expect the process to reverse.
But just how much of a sell-off can we expect? Not much, for three reasons.
First, inflation is non-existent. Here is a chart of the Y/O/Y percentage change in total and core CPI:

Both core and total inflation are running below 2% on a year over basis. And with commodity prices under control, China slowing and the EU in a depression, it's highly doubtful we'll see massive price spikes in the near future. (In fact, we could probably use a little more inflation).
Secondly, the US population is getting older. The most commonly stated fact to support this statement is that, thanks to the baby boomers, we're seeing 10,000 people retire per day. As people get older, their' investment strategy becomes more conservative, hence an increase in bond market purchases.
Third, there's still a tremendous amount of uncertainly out there. While it appears that China has averted a credit crunch for now, their central bank is clearly clamping down on the shadow lending business, which will further clow Chinese growth. The Chinese slowdown, in turn, is negatively impacting raw materials exporters like Australia and Latin America. The US is certainly not setting any growth records and Brazil, India and Russia are facing their own set of difficulties. Put more generically, this is an environment where having a percentage of a portfolio yielding 2.5%-3% is an attractive feature.
While an uptick in yields was bound to happen eventually (and is obviously happening now), the above three reasons should limit the upside increase.
The biggest move has come in the fixed income markets. As the FT has noted, we've seen a huge sell-off in bonds from both central banks and investors at large:
Holdings of US Treasuries held at the Fed on behalf of official foreign institutions dropped a record $32.4bn to $2.93tn, eclipsing the prior mark of $24bn in August 2007. It was the third week of outflows in the past four.
Private investors are also dumping fixed income. Bond funds tracked by EPFR Global, a data provider, saw total redemptions of $23.3bn in the week to June 26. US funds were the worst hit, with withdrawals totalling $10.6bn, but emerging market debt funds also saw record redemptions of $5.6bn.
This is to be expected as the Fed has essentially placed a permanent floor in the bond market for the last three years. At the same time, it's important to ask if the sell-off is overdone. First, the Fed hasn't started to taper yet. And a careful reading of their statement indicates that they may not even do it if the economy slows too much. Read in light of last week's downgrade of US growth for the first quarter, it's entirely likely that the Fed's plans may already be put on hold. Also remember the Fed will continue to reinvest principal payments as they come due.
At the same time, let's also remember that Treasury rates are at historic lows, as shown on this chart from the St. Louis Fed:

Since the beginning of the 1980, we've had a permanent rally in the fixed income market, essentially taking rates as low as they can conceivable go. So, at some point, we have to expect the process to reverse.
But just how much of a sell-off can we expect? Not much, for three reasons.
First, inflation is non-existent. Here is a chart of the Y/O/Y percentage change in total and core CPI:

Both core and total inflation are running below 2% on a year over basis. And with commodity prices under control, China slowing and the EU in a depression, it's highly doubtful we'll see massive price spikes in the near future. (In fact, we could probably use a little more inflation).
Secondly, the US population is getting older. The most commonly stated fact to support this statement is that, thanks to the baby boomers, we're seeing 10,000 people retire per day. As people get older, their' investment strategy becomes more conservative, hence an increase in bond market purchases.
Third, there's still a tremendous amount of uncertainly out there. While it appears that China has averted a credit crunch for now, their central bank is clearly clamping down on the shadow lending business, which will further clow Chinese growth. The Chinese slowdown, in turn, is negatively impacting raw materials exporters like Australia and Latin America. The US is certainly not setting any growth records and Brazil, India and Russia are facing their own set of difficulties. Put more generically, this is an environment where having a percentage of a portfolio yielding 2.5%-3% is an attractive feature.
While an uptick in yields was bound to happen eventually (and is obviously happening now), the above three reasons should limit the upside increase.
Economic/Market Analysis: US
Let's take a look a the news from last weed, then follow up with the markets.
The good
Manufacturing sub-indexes gave us some good news. The Dallas Fed's manufacturing index increased to 17.1. Many of the sub-categories of indicators also increased. New orders for durable goods increased 3.5%; the total was up .7% ex-transportation. This figure has increased 3 of the last 4 months, which should help to alleviate the downward pressure we're seen in the manufacturing sector over the last few months. Finally, the Richmond Fed's index increased 10 points to 8.
We had more good news from the housing market. The case shiller home price index increased month to month and year over year. The 10-city index increased 2.6% M/M and the 20 city index increased 2.5% M/M/ The year over year numbers were 11.6% and 12.1%, respectively. New home sales increased 2.1% M/M and 29% Y/Y.
Consumer confidence rose to a recovery best: Consumer confidence is at a recovery best, at 81.4 in June and up nearly 7 points from a revised 74.3 in May for the third straight strong gain. The assessment of the present situation is also up for a third straight month, at a recovery best 69.2 which hints at general strength for the slate of June indicators. But the gain here does mask a small uptick in those who say jobs are hard to get, now at 36.9 percent for a 5 tenths increase that does not point to new gains for the June employment report.
Personal income and disposable personal income both increased .5% in May, month to month.
Although the Chicago PMI decreased, the internals were very positive: Growth in business activity has slowed sharply this month based on the Chicago PMI which came in at 51.6, down 7.1 points from May. Big moves aren't unusual for this index but a look at the details points to solid growth in the area with new orders coming in at a very respectable 54.6 to indicate healthy monthly growth though down from an outsized 58.1 in the prior month. Production rose solidly, but again at a slower rate, while employment picked up in the month. A big contraction in backlog orders is a negative in the report. Other details include a shortening in delivery times, consistent with slowing conditions, and a slight rise in price pressures for raw materials. Though details are mostly positive, the Dow is slipping in initial reaction to this report which covers all areas of the Chicago economy and not just manufacturing.
The Neutral
The Chicago Fed's National Activity Index's three month moving average decreased: The index’s three-month moving average, CFNAI-MA3, decreased to –0.43 in May from –0.13 in April, marking its third consecutive reading below zero and its lowest level since October 2012. May’s CFNAI-MA3 suggests that growth in national economic activity was below its historical trend. The economic growth reflected in this level of the CFNAI-MA3 suggests subdued inflationary pressure from economic activity over the coming year.
Only one of the four indicator groups made a positive contribution, although two of the groups did improve. The only really good news coming from this reading is that a period of subdued economic activity should have minimal inflationary pressures.
The bad
First quarter GDP was revised lower, from 2.4% to 1.8%. Lower readings from both PCEs and imports/exports were the primary reason for the move lower: the increase in personal consumption expenditures (PCE) was less than previously estimated, and exports and imports are now estimated to have decline.
The Kansas City Fed's manufacturing index fell from 2 to -5. This particular index had fairly severe deterioration in its dub-indexes, most likely due to the several severe weather incidents over the last few months: Production fell at both durable and non-durable goods-producing plants, with food and machinery manufacturing particularly weak. Other month-over-month indexes showed mixed results. The production index dropped from 5 to -17, its lowest level since March 2009, and the shipments and new orders indexes also fell markedly. The order backlog and employment indexes increased somewhat but still remain slightly below zero. Both inventory indexes edged higher after falling in May.
Let's turn to the markets.


The daily SPY chart (bottom chart) shows that prices are currently using the top Fib fan as technical support. And while momentum and CMF are clearly negative, the market are hardly falling out of bed. As the 60 minute chart shows (top chart), we essentially have a situation where the market is dropping, and then rallying on the perceived value play that arises at those lower levels.

The IEFs have broken through support at the 105 level, fell to ~101 (a drop of about 3.8%) but then caught a bid that hit resistance just below the 10 day EMA. Momentum is weak and volume flow is negative. I'll highlight this market later today.

The real story of the dollar is that we're seeing it continue to trade within a broad range between 21.5 and 23.2. Until we break out of this range, most movement is really just noise.
The good
Manufacturing sub-indexes gave us some good news. The Dallas Fed's manufacturing index increased to 17.1. Many of the sub-categories of indicators also increased. New orders for durable goods increased 3.5%; the total was up .7% ex-transportation. This figure has increased 3 of the last 4 months, which should help to alleviate the downward pressure we're seen in the manufacturing sector over the last few months. Finally, the Richmond Fed's index increased 10 points to 8.
We had more good news from the housing market. The case shiller home price index increased month to month and year over year. The 10-city index increased 2.6% M/M and the 20 city index increased 2.5% M/M/ The year over year numbers were 11.6% and 12.1%, respectively. New home sales increased 2.1% M/M and 29% Y/Y.
Consumer confidence rose to a recovery best: Consumer confidence is at a recovery best, at 81.4 in June and up nearly 7 points from a revised 74.3 in May for the third straight strong gain. The assessment of the present situation is also up for a third straight month, at a recovery best 69.2 which hints at general strength for the slate of June indicators. But the gain here does mask a small uptick in those who say jobs are hard to get, now at 36.9 percent for a 5 tenths increase that does not point to new gains for the June employment report.
Personal income and disposable personal income both increased .5% in May, month to month.
Although the Chicago PMI decreased, the internals were very positive: Growth in business activity has slowed sharply this month based on the Chicago PMI which came in at 51.6, down 7.1 points from May. Big moves aren't unusual for this index but a look at the details points to solid growth in the area with new orders coming in at a very respectable 54.6 to indicate healthy monthly growth though down from an outsized 58.1 in the prior month. Production rose solidly, but again at a slower rate, while employment picked up in the month. A big contraction in backlog orders is a negative in the report. Other details include a shortening in delivery times, consistent with slowing conditions, and a slight rise in price pressures for raw materials. Though details are mostly positive, the Dow is slipping in initial reaction to this report which covers all areas of the Chicago economy and not just manufacturing.
The Neutral
The Chicago Fed's National Activity Index's three month moving average decreased: The index’s three-month moving average, CFNAI-MA3, decreased to –0.43 in May from –0.13 in April, marking its third consecutive reading below zero and its lowest level since October 2012. May’s CFNAI-MA3 suggests that growth in national economic activity was below its historical trend. The economic growth reflected in this level of the CFNAI-MA3 suggests subdued inflationary pressure from economic activity over the coming year.
Only one of the four indicator groups made a positive contribution, although two of the groups did improve. The only really good news coming from this reading is that a period of subdued economic activity should have minimal inflationary pressures.
The bad
First quarter GDP was revised lower, from 2.4% to 1.8%. Lower readings from both PCEs and imports/exports were the primary reason for the move lower: the increase in personal consumption expenditures (PCE) was less than previously estimated, and exports and imports are now estimated to have decline.
The Kansas City Fed's manufacturing index fell from 2 to -5. This particular index had fairly severe deterioration in its dub-indexes, most likely due to the several severe weather incidents over the last few months: Production fell at both durable and non-durable goods-producing plants, with food and machinery manufacturing particularly weak. Other month-over-month indexes showed mixed results. The production index dropped from 5 to -17, its lowest level since March 2009, and the shipments and new orders indexes also fell markedly. The order backlog and employment indexes increased somewhat but still remain slightly below zero. Both inventory indexes edged higher after falling in May.
Let's turn to the markets.


The daily SPY chart (bottom chart) shows that prices are currently using the top Fib fan as technical support. And while momentum and CMF are clearly negative, the market are hardly falling out of bed. As the 60 minute chart shows (top chart), we essentially have a situation where the market is dropping, and then rallying on the perceived value play that arises at those lower levels.

The IEFs have broken through support at the 105 level, fell to ~101 (a drop of about 3.8%) but then caught a bid that hit resistance just below the 10 day EMA. Momentum is weak and volume flow is negative. I'll highlight this market later today.

The real story of the dollar is that we're seeing it continue to trade within a broad range between 21.5 and 23.2. Until we break out of this range, most movement is really just noise.
Sunday, June 30, 2013
Three thoughts for Sunday: the funniest person on the entire internet, an unfunny sitaution at the Supreme Court, and how to cut the cord?
- by New Deal democrat
[Note: regular nerdy economic blogging will resume tomorrow. Meanwhile, here are three basically random thoughts]
1. The funniest person on the entire internet, bar none...
... is KevJumba's dad.
And the above is just a pale imitation of the flashback where he is handed his newborn son, and while cradling him immediately starts to lecture: "You're going to be a doctor. Or a lawyer."
2. Is Justice Scalia showing signs of dementia?
I'm being serious here. Yes, I disagree strongly with his opinions. But he used to be a whole lot sharper. He wouldn't have authored language in one opinion that directly and funadamentally refuted his diametrically opposed opinion from a mere 24 hours before, like he did this week in the DOMA opinion about fealty to history, that was in direct contradiction to the majority opinion he signed on to that entirely jettisoned the text, Congressional intent, and history of the Fifteenth Amendment in the Voting Rights Act case.
And that's not all. In the last couple of years he has brazenly given speeches directly opining on cases pending before the Court. This is a serious breach of judicial decorum to say the least. Then there was the gasp-inducing "racial entitlements" comment. And a google search of the issue led me to this note about what seems like a pretty serious mental lapse on the Bench last year during the ACA legal arguments:
[T]he “Jack Benny” exchange in the Medicaid expansion argument is simply embarrassing, another example of Justice Scalia losing control of his own cleverness – to the point where the Chief Justice had to step in and say, “That’s enough frivolity for a while,” but only after Justice Scalia realized that he had gotten completely off track with his own intervention (he was playing around with “your life” and “your wife,” but at the very end, after the Chief Justice tried to get him to stop with, “Let’s leave the wife out of this,” Justice Scalia said, “I’m talking about my life,” which completely undermines the point, such as it was, that he was trying to make).The guy is 77 years old. We're probably all familiar with grampa or aunt Minnie who suddenly seemed to lose their brain's "governor" at about that age - if something entered their mind, it exited their mouth. We also have the example of David Brinkley, who at 76 after nearly half a century in broadcasting had a very senior moment on-air on the night of the 1996 presidential election, excoriating the result. Then there's Helen Thomas, who after half a century as a leading White House correspondent was summarily fired after she let loose with some anti-Israeli diatribes.
If Scalia is beginning to show signs of dementia, there will be fascinating but ugly political battles inside the Court itself as other conservatives try to hide his diminishing capacity from the other branches of government and the public - not to mention keeping it out of his opinions - and inside the Senate as GOPers try to ensure that the balance of power in the Supreme Court cannot be shifted during Obama's second term.
3. Finally, you may not realize it, but over 90% of my posts for the last year have been written on a tablet. I officially "cut the cord" for internet service at my residence. (That should explain some of the odd grammar and punctuation that shows up in some of these posts, when I lose my battle with what Apple is sure I want to say and how I want to say it).
Now I'm considering cutting the television cable as well. What options should I explore?
Saturday, June 29, 2013
Weekly Indicators: one year into ECRI's recession edition
- by New Deal democrat
According to ECRI, tomorrow will mark the end of the first year of a recession. During that time, GDP, real consumer spending, real incomes, industrial production, and employment have all risen (perhaps explaining why there hasn't been an update to their "telltale chart" in over half a year). Turning to May monthly data, last week only the Chicago PMI was down, to a point just slightly into expansion. All the other monthy data was positive: personal income, spending, savings, durable goods, consumer sentiment, Case-Shiller house prices, and new home sales.
Turning to the high frequency weekly indicators, last week I noted that two of the long leading indicators, interest rates and mortgage applications, had turned negative, while money supply remained positive. That pattern modified a little this week:
Interest rates and credit spreads
- 5.11% BAA corporate bonds up +0.12%
- 2.33% 10 year treasury bonds up +0.13%
- 2.90% credit spread between corporates and treasuries down -0.01%
Housing metrics
Mortgage applications from the Mortgage Bankers Association:
- +2% w/w purchase applications
- +16% YoY purchase applications
- -5% w/w refinance applications
Housing prices
- YoY this week +7.9%
Real estate loans, from the FRB H8 report:
- unchanged w/w
- up +0.9% YoY
- +2.7% from its bottom
Money supply
M1
- -0.6% w/w
- +1.8% m/m
- +8.9% YoY Real M1
M2
- unchanged w/w
- -0.5% m/m
- +5.4% YoY Real M2
Employment metrics
American Staffing Association Index
- 93 unchanged w/w, unchanged YoY
- 346,000 down -8,000
- 4 week average 345,750 down -2500
- $143.1 B for the first 19 days of June vs. $132.0 B last year, up +$11.1 B or +8.4%
- $148.1 B for the last 20 reporting days vs. $139.4 B last year, up $8.7 B or +6.2
Transport
Railroad transport from the AAR
- unchanged carloads YoY
- +3100 carloads or +1.8% ex-coal
- +6600 or +2.7% intermodal units
- +6400 or +1.2% YoY total loads
- Harpex -02 to 401
- Baltic Dry Index up 134 to 1161
Consumer spending
- ICSC +1.1% w/w +1.8 YoY
- Johnson Redbook +2.8% YoY
- Gallup daily consumer spending 14 day average at $87 up $18 YoY
Oil prices and usage
- Oil $96.56 up +$2.87 w/w
- Gas $3.57 down -$0.06 w/w
- Usage 4 week average YoY -0.3%
Bank lending rates
- 0.23 TED spread unchanged w/w
- 0.190 LIBOR down -0.003% w/w
JoC ECRI Commodity prices
- down 0.53 to 120.75 w/w
- +5.43 YoY
Consumer spending remained positive, but less so than recently. More positives included house prices, YoY purchase mortgage applications, overnight bank rates, both rail and shipping transport. Weak positives included jobless claims, tax withholding, and real estate loans. Gas prices and commodity prices rate as neutrals this week.
My conclusion this week is the same as last week: the sharp rise in interest rates is definitely of concern, but it hasn't lasted long enough to seriously signal a recession next year. Housing is weakening but still positive. In terms of coincident indicators of the economy, consumer spending and initial jobless claims, while trending more weakly positve and sideways, respectively, for the last month or so, show no signs of rolling over.
Have a nice weekend.
Friday, June 28, 2013
Weekend Weimar, Beagle and Pit Bull
It's that time of the week.
I'll be back on Monday (for a holiday shortened week). NDD will be here over the weekend.
Until then:


I'll be back on Monday (for a holiday shortened week). NDD will be here over the weekend.
Until then:


Emerging Market Slowdown May Not Hurt US Much
The following chart is from Dr. Ed's blog:
 Tightening global credit conditions and weakening commodity prices
threaten also to depress emerging economies. How important are they to
the US? More so than in the past, but not enough to hurt the US economy
much at all. Total exports of goods and services account for 14% of
nominal GDP. Merchandise exports to emerging economies account for 67%
of total exports currently, up from about 50% in 1990. The good news is
that US commodity imports have gotten cheaper.

Muni and Mortgage Market Sell-off in Perspective


The municipal bond market (MUB, top chart) and the mortgage bond market (MBB lower chart) have both broken support as a result of the recent Fed moves. But both of these moves were have been telegraphed for the last 9-12 months by the declining MACD. Also note the both have bounced backed fairly strongly this week as traders have clearly found some degree of value in the levels from last week.
The point to this chart is that when we pull back the lens to the weekly charts, we notice that the panic caused by the Fed's announcement was a bit overdone.
Thursday, June 27, 2013
And right on cue ...
- by New Deal democrat
Yesterday I warned against wage and income comparisons made between the last quarter of 2012 and the first quarter of 2013. Because of the "fiscal cliff" and the general expectation that some if not all of the Bush tax cuts were going to expire at the start of this year, lots of compensation that would have been paid in the first quarter of this year was moved forward into the last quarter of last year. In fact, when you averge the two quarters together, by the end of the first quarter of this year, real wages and real income were at new highs. But cherry-picking the quarter over quarter comparisons is making for lots of Doomer nonsense.
So I was cruising the progressive blogosphere to see if anyone had yet noticed the likley negative impact of the Fed taper, when lo and behold, somebody finally did. Kudos to him for doing so, and by and large I agree with his opening few paragraphs. But because it is getting lots of hits, because it does fall into several Doomer traps, and because I know many of our readers read there also, let me set the record straight.
Here's the several paragraphs I disagree with:
The fact that [personal consumption expenditures][are] lower than [they were during the height of the 2008-09 panic should give people some cause for concern.
The explanation for this crash in spending can be found here:Real per capita disposable incomes took yet another hit. The astonishing annualized contraction of real per capita disposable income has now reached -9.21%........
Quantitative easing's function is to make it easier to borrow, thus increasing the level of debt in the economy and the amount of deflationary forces.
Ummm, no.
The first mistake is that personal consumption isn't lower than it was during the last recession. It has been consistently rising.

The writer uses this same graph but showing YoY% changes, i.e., personal consumption expenditures aren't "crashing" at all, merely improving at a decelerating rate.
The second mistake is the same mistake we saw with regard to real wages yesterday: citing the decline in the first quarter without reference to the even bigger increase in Q4 2013. Here's real per capita discposable income for the last ten years, measured monthly (red) and quarterly (blue) (Note that since the second quarter isn't finished, there is no measurement for this quarter, although April and May are shown on the monthly data):

Real per capita disposable income is actually higher in April and May than it has ever been since the recession, with the exception of the November and December spike. The "astonishing annualized contraction" is nonsense. It only exists in comparion with the "astonishing annualized rise" in the same metric in 4Q 2012.
The final mistake is that households haven't increased their debt at all. Consumer debt is down about 14% from its peak a few years ago, and the household debt burden is at its lowest rate, ex one quarter, since the series was started over 30 years ago:

And it isn't just the ratio of debt payment to income, the total amount of debt payments, per capita, adjusted for inflation, is also down about 14% since its peak in the last recession:

Whatever other flaws it may have, quantitative easing has allowed households to refinance debt, or pay down debt, and considerably lower interest rates. The problem with the "taper" is that if it causes a sustained risse in intereest rates, that source of oxygen to the consumer will be shut off. Since no significant improvement in real wages looks likely soon, that could cause a recession (but probably not for another year or even two) and with that might come real wage deflation. That is my biggest longer term fear.
So, although the writer gets lost along the way - i.e., things are by no means "crashing" now - I think he winds up at the correct destination.
The Treasury Market Sell-Off in Perspective
Let's take a step back and put the recent market action into perspective by looking at the weekly charts.


Both the IEIs (5-7 year) and IEFs (7-10 year) have similar charts, with perhaps the biggest feature the declining MACDs, which have been moving lower for about a year each. Also of importance are the weakening CMF readings displayed on both charts. Finally, both charts broke through key supprt levels during the recent sell-off (for the IEIs it was 122 and IEF it was 105).
Right now, the key line of support for both is the top Fib fan.


The TLHs (top chart, 10-20 years) and TLTs (bottom chart, 20+ years) have very similar structures. Both broke support in the recent sell-off, but both have support from either a Fib level (TLHs, top chart) or a previous price level (TLTs, bottom chart). One of the main features of both charts is the declining MACD which has been falling for the last year.


Both the IEIs (5-7 year) and IEFs (7-10 year) have similar charts, with perhaps the biggest feature the declining MACDs, which have been moving lower for about a year each. Also of importance are the weakening CMF readings displayed on both charts. Finally, both charts broke through key supprt levels during the recent sell-off (for the IEIs it was 122 and IEF it was 105).
Right now, the key line of support for both is the top Fib fan.


The TLHs (top chart, 10-20 years) and TLTs (bottom chart, 20+ years) have very similar structures. Both broke support in the recent sell-off, but both have support from either a Fib level (TLHs, top chart) or a previous price level (TLTs, bottom chart). One of the main features of both charts is the declining MACD which has been falling for the last year.
Market/Economic Analysis: India
last week, the Indian ETF lost nearly 6% in the emerging market sell-off. As I've noted previously, I'm bearish on the economy (see also here). Let's look at the latest Central Bank policy statement to get an overview of the current economic environment.
In May, the Central Statistics Office (CSO) reported India’s GDP growth in Q4 of 2012-13 of 4.8 per cent, a marginal improvement over the previous quarter. During the current financial year, the growth of industrial production decelerated to 2.3 per cent in April after picking up in the preceding month. All constituent categories of industry have slowed, with a persistent contraction in mining activity. The sharp weakening in the growth of capital goods production points to still damped investment demand whereas a pick-up in consumer non-durables could be indicative of a fragile return of consumer confidence. On the other hand, the services sector purchasing managers’ index rose in May on order flows. The onset of the south-west monsoon has been strong and on time.
Let's place this slowdown into historical perspective:
 The economy has definitely slowed from a 9% annual growth rate to 4.8% -- nearly a halving in output. For a country that is trying to life hundreds of millions out of poverty, that is the wrong direction.
Headline WPI inflation eased for three months in succession with the May reading at 4.7 per cent, down from an average of 7.4 per cent in 2012-13. All constituent categories, barring food, have moderated. In the fuel category, coal and mineral oil prices declined, partly offsetting the upward revision in administered prices of electricity. Non-food manufactured products inflation too ebbed, driven by metal prices which fell for the eighth successive month in response to softening of global prices. Still elevated food inflation, particularly in respect of cereals and vegetables, sustained upside pressures on overall inflation. Retail inflation, as measured by the new combined (rural and urban) CPI, edged down from an average of 10.2 per cent last fiscal year to 9.3 per cent in May.

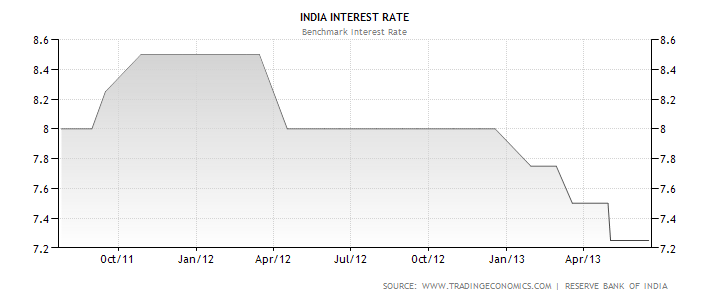
This is one piece of good news: over the last three months there has been a marked drop in the inflation rate. This may allow them to lower rates further:
 However, let's not get too excited about growth prospects just yet. India has done little to nothing to alter their primary problems: a dilapidated infrastructure system, poor political environment, high budget deficit and current account deficit.
Let's turn to the market.

The Indian ETF was trading in a range between ~55 and ~62 for a period of 8 months. Prices broke through support at the 56 level in early June and have been moving lower since. Notice the two gaps lower on the chart, indicating big volume moves lower. Now the shorter EMAs have moved through the 200 day EMA, with negative momentum and CMF readings.
In May, the Central Statistics Office (CSO) reported India’s GDP growth in Q4 of 2012-13 of 4.8 per cent, a marginal improvement over the previous quarter. During the current financial year, the growth of industrial production decelerated to 2.3 per cent in April after picking up in the preceding month. All constituent categories of industry have slowed, with a persistent contraction in mining activity. The sharp weakening in the growth of capital goods production points to still damped investment demand whereas a pick-up in consumer non-durables could be indicative of a fragile return of consumer confidence. On the other hand, the services sector purchasing managers’ index rose in May on order flows. The onset of the south-west monsoon has been strong and on time.
Let's place this slowdown into historical perspective:

Headline WPI inflation eased for three months in succession with the May reading at 4.7 per cent, down from an average of 7.4 per cent in 2012-13. All constituent categories, barring food, have moderated. In the fuel category, coal and mineral oil prices declined, partly offsetting the upward revision in administered prices of electricity. Non-food manufactured products inflation too ebbed, driven by metal prices which fell for the eighth successive month in response to softening of global prices. Still elevated food inflation, particularly in respect of cereals and vegetables, sustained upside pressures on overall inflation. Retail inflation, as measured by the new combined (rural and urban) CPI, edged down from an average of 10.2 per cent last fiscal year to 9.3 per cent in May.

This is one piece of good news: over the last three months there has been a marked drop in the inflation rate. This may allow them to lower rates further:
Let's turn to the market.

The Indian ETF was trading in a range between ~55 and ~62 for a period of 8 months. Prices broke through support at the 56 level in early June and have been moving lower since. Notice the two gaps lower on the chart, indicating big volume moves lower. Now the shorter EMAs have moved through the 200 day EMA, with negative momentum and CMF readings.
Wednesday, June 26, 2013
No, real wages are not falling
- by New Deal democrat
About a month ago, I came across a post on Mish's blog claiming we were DOOMED because real wages had plummeted by 5% in the first quarter of this year alone, based on productivity and unit labor costs. As I normally do, I actually clicked through on the link to find the source data. A few minutes of poking around showed decisively that Mish's reasoning was fallacious. Since a lot of his own commenters called him on it, I didn't see any need to pile on.
Unfortunately, this claim has just come back big time, being touted by a Pulitzer Prize winning journalist, David Cay Johnston, and picked up by Prof. Brad DeLong. It is utter nonsense. I left a couple of comments at Prof. DeLong's blog, but I wanted to back up my claims with the graphical truth.
To begin with, as the BLS makes clear, it's definition of "wages" in this report includes non-standard compensation, i.e., things like bonuses. This turns out to be important, because when you examine the table helpfully provided with the report, particularly the sixth column from the left, "real compensation per hour," you see the -4.6% statistic for the first quarter of this year touted by Mish and Johnston. And literally directly below it, you see the increase of +7.8% for the 4th quarter of last year. Don't believe me? Here's a copy of the table:
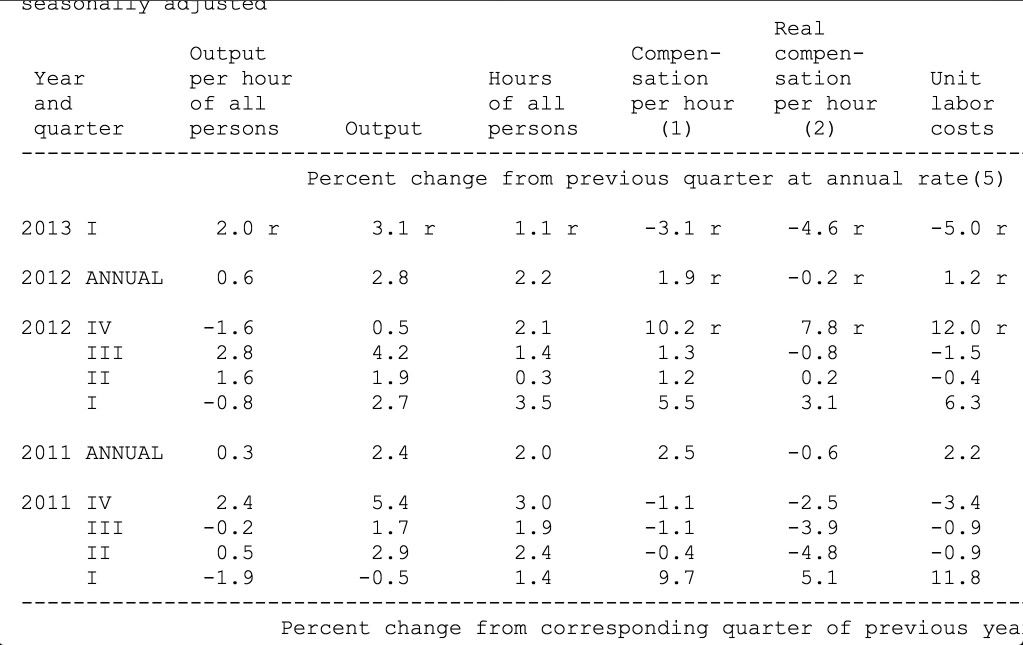
And here is the table with the raw index values:
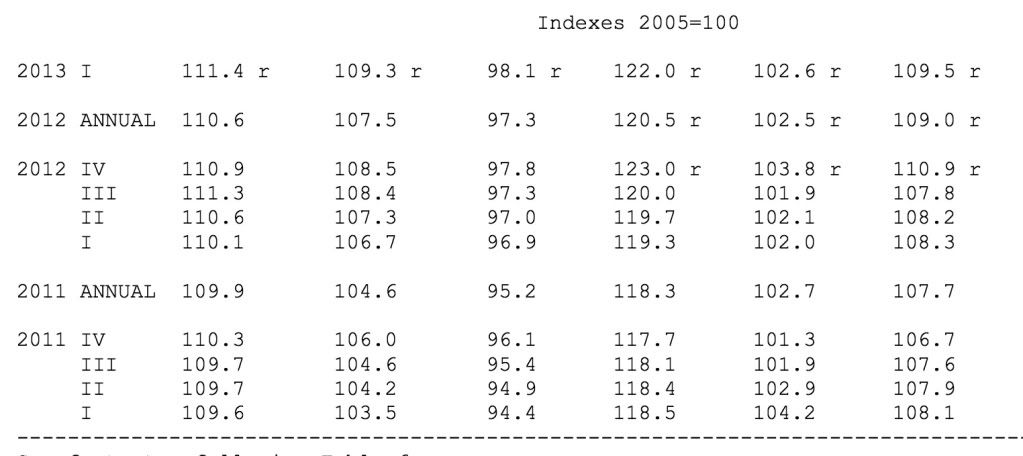
Notice that the index bottomed in 4Q 2011 and rose since then, but just as with the similar statistic of real personal income, there is a big spike from discretionary income being moved forward to the last quarter of last year to minimize any impact from the expiration of the Bush tax rates. And just like real personal income, compensation after the spike is still higher than compensation before it.
Here's the longer term graph of real compensation per hour for the last half century:
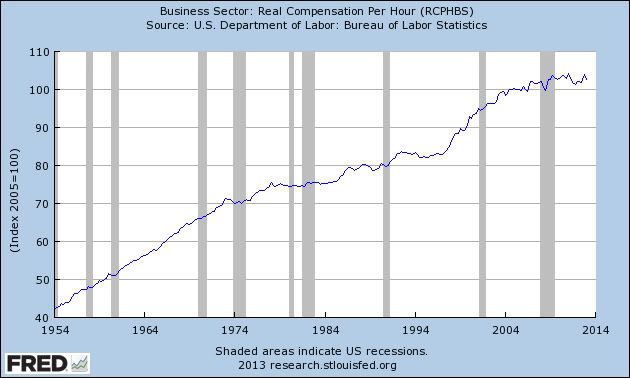
The best case to make is that real wages in this series have stagnated for over 5 years. They peaked in Q1 2011, declined almost 3% over the next 3 quarters, and have increased roughly 1% since then.
The second claim made by Johnston is:
It is not like this new wage news can be dismissed as an anomaly, either. It is evidence of a troubling trend – falling incomes for the 99 percent.Did you notice the subtle change? Johnston starts by implying that falling wages are part of a trend, but then cites an income statistic. But there's a big difference, since income includes things like bank interest and Social Security benefits.
....
From 2007 to 2011 the average pretax income of the bottom 90 percent fell from $35,173 to $30,437. That is a drop of more than $4,500. It is also a decline of nearly 13 percent.
This too is nonsense as alleged proof of falling real wages, and I saw it coming a month ago, after Doug Short posted an update about median household income. It got picked up widely, and was widely misinterpreted by Doomers as a decrease in *wages.* It ain't so. Here's Doug Short's graph:
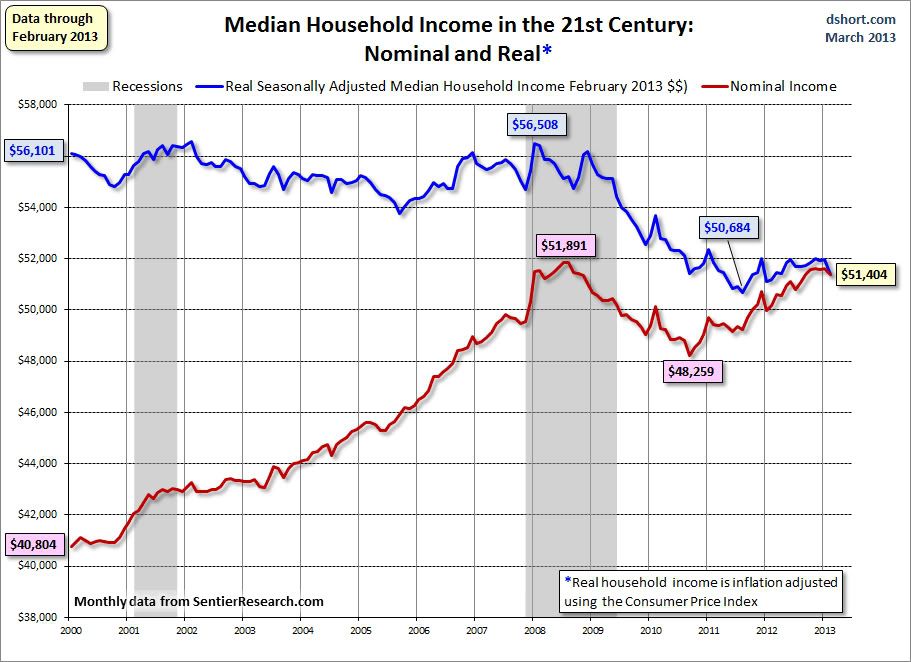
Notice that median household income declined about 10% into 2011, and since then has slowly risen, although it is still about 7% under its 2007 pre-recession peak.
The data Johnston uses is similar to that tracked by Doug Short. Ultimately it comes from a study by Saez and Piketty on worsening income inequality. They make the case - and I have no reason to doubt that it is absolutely true - that income inequality has worsened since the onset of the great recession. Just like the "median household income" tracked by Doug Short, Saez and Piketty find a large drop in "average pretax income" from 2007 through 2011.
But the index isn't measuring wages. It is measuring income, which includes in that mix households with wage-earners, households where one or more adults is unemployed, and households where one or more adults is retired. Here's the relevant passage from Sentier Research, which compiles the data used by Doug Short:
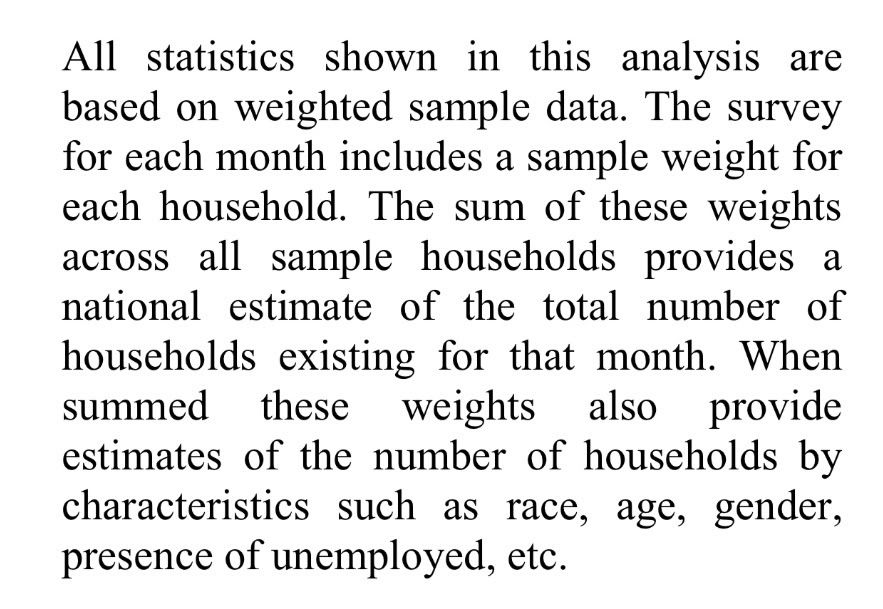
Just to be sure, I contacted them directly and they confirmed the above to me.
Similarly, footnote 3 to the paper reported by Saez and Piketty indicates that data from all households was used.
Well, as you probably already know, there is a major demographic shift as Boomers retire, meaning that a larger number of persons and households are non-wage-earning households. Further, we know from the employment to population ratio, a lot of people have dropped out of the workforce:
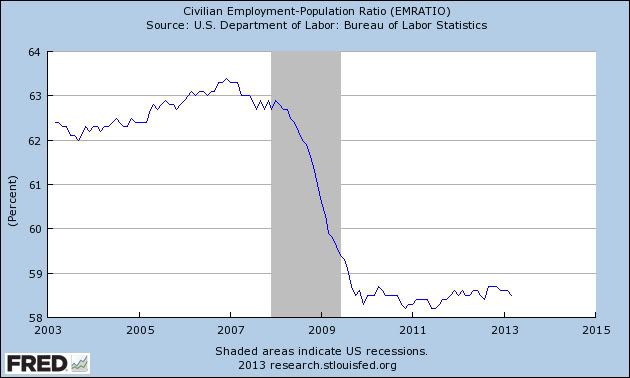
Note that even in the case of retirement, salary or wage income stops and is replaced only by Social Security and pension income plus any income of past savings or investment, such as certificates of deposit, return on which has functionally fallen to zero in the last 5 years. In other words, it's almost always a lot lower than the previous wage and salary income. So the decline in income as measured by Doug Short and by Saez and Piketty mirrors the downward change in the employment to population ratio, because they are measuring very similar things.
What we really want to know is what is happening with the median wage, and something about the spread in wages. And as it happens, there is a statistic that comes out every quarter that tell us what the median wage is. It's called the Employment Cost Index, and here it what it shows as to wages:
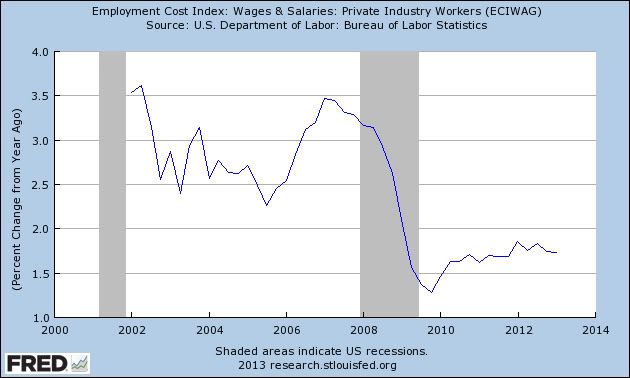
With median wages rising only about 1.5% YoY or so, even a 2% YoY inflation rate causes most Americans to lose ground.
Don't get me wrong. As I've hopefully made clear many times on this blog, I consider real wage stagnation to be one of the biggest problems we face. Creating more jobs and increasing real wages ought to be Washington's highest priority.
But what we have here is a Pulitzer prize winning journalist who apparently either isn't following up on his sources - or in the case of first quarter unit wages, hasn't even looked 1/4 inch further down the column. Or else we have intellectually dishonest Doomer scaremongering, grafting together income data of questionable relevance to actual wages, with one cherry-picked subsequent quarter of wage data showing a decline from a previous high. I want to hope it is just the former, but given the evidence, it's hard for me to entirely dismiss the idea that it's the latter.
Chinese Markets Are Now At Critical Support

Above is a weekly chart of the Shanghai index. Last week it fell sharply; it dropped lower earlier this week, but has since rallied to key support levels. The 1950 level is of obvious technical importance to the index; a solid move below that level, confirmed by several days closing below that level would have a profound negative impact on world markets.
Copper Is At Critical Support

Notice the incredibly weak position of the copper ETF. It's trading near 1-year lows; prices are below the 200 day EMA (which is also moving lower). All the shorter EMAs are below the 200 and moving lower. Momentum is incredibly weak.

On the weekly chart, prices are right around the 36-37 level, which has provided critical technical support for the last three and a half years.
Tuesday, June 25, 2013
BOJ's Initial Actions Effective

The above charts shows the currency problem faced by the BOJ: even as their interest rates were at record lows and their economy was barely growing, the yen was strengthening. The ETF rose from 90 in mid-2008 to 130 at the end of 2011, for a percentage gain of 44%. The banks recent moves to double the currency base has effectively told the markets the central bank intends to have the yen drop in value -- which it clearly has. It's moved from from the high of 130 to 94 earlier this year, for a drop of 27.4%.
1% increase in interest rates: necessary but not sufficient for recession
- by New Deal democrat
At this point probably everybody who pays attention knows that interest rates have backed up a full 1% in the last month. That it will have a strong negative impact on mortgage refinancing and some negative impact on the purchase of houses also has been widely remarked.
But is it enough to bring on a recession? No, or at least, not yet.
As it turns out, while recessions in the last 50 years have always been preceded by a 1% YoY increase in interest rates, a backup in interest rates is not a sufficient signal by itself to forecast a recession. I've shown this in the below graph of 10 year treasuries. The values are inversted so an increase shows up as a decrease. I've also added 1 to the values, so that a +1% increase in interest rates shows up exactly at zero:
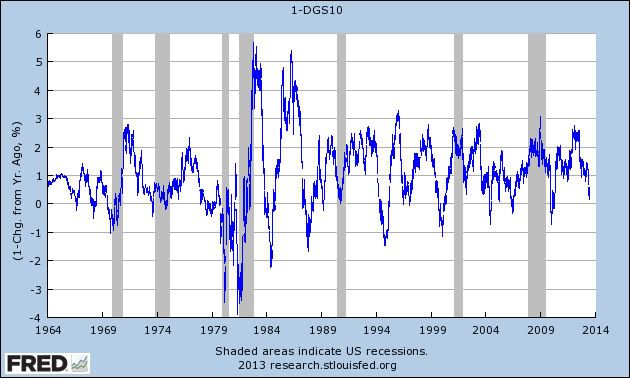
Interest rates have backed up at least 1% YoY 15 times in the last 50 years. In 7 of those cases, a recession has folloed within the next 2 years. So the increase in rates is a necessary but not sufficient marker of recession.
What has made a difference is the duration of the increase, at least since the beginning of the great decline in interest rates over 30 years ago. Below is a graph that I posted a little over one year ago, showing conventional mortgage rates since their peak in 1980. The red sections represent those periods of time where mortgage rates have failed to make a new low for at least 3 years:

As you can see, all three of the recessions since 1982 have been immediately preceded by a 3 year or longer period where interest rates failed to make new lows.
Interest rates on mortgages made new lows about 1 year ago. So while the rise in interest rates is a definite concern, it hasn't lasted long enough to trigger a warning of a new recession. We'd need to see the increased rates continue for another year or even two before a recession would likely occur.
Market/Economic Analysis: Australia
While I've previously been bearish on Australia, my position is now changing to neutral. There are two reasons for this change. First, the ETF has already fallen 20%, which is a bug move for an economy that is still printing decent GDP growth. Second, the LEIs have now printed a positive number for four straight months. This is from the latest Conference Board release:
The Conference Board LEI for Australia increased in April for a fourth consecutive month, with money supply and stock prices making the largest positive contributions. Between October 2012 and April 2013, the leading economic index increased 0.7 percent (about a 1.5 percent annual rate), up from a decline of 0.4 percent (about a -0.8 percent annual rate) during the previous six months. Additionally, the strengths among the leading indicators have remained more widespread than the weaknesses in recent months.
Here is a copy of the components:

In general, we see a positive contribution from most components over the last 4-5 months with two exceptions: building approvals and the sales to inventory ratio. All other points are doing well. Let's now turn to the CEIs:

Like the LEIs, the CEIs are now printing mostly positive numbers.
Here's the assessment of the economy from the latest meeting minutes of the central bank:
Exports had grown further in the March quarter. Resources exports, particularly of bulk commodities, had grown strongly over the past year, while services exports had resumed growth more recently.
Available information indicated that business investment had declined in the March quarter. According to the latest ABS capital expenditure survey, the decline had been in both the mining and non-mining sectors. The fall in capital imports since the beginning of the year was consistent with a decline in investment in the first quarter, although recent data showed that capital imports had bounced back somewhat in April.
According to the ABS survey of firms' capital expenditure plans, non-mining investment was expected to show moderate growth over the next year or so. While the survey also continued to imply further growth in mining investment, in the past actual annual capital expenditure by mining companies had often differed by a wide margin from their forecasts as reflected in the ABS survey. Based on public statements by mining companies and information from the Bank's liaison, it seemed likely that mining investment was near its peak but would probably remain at a high level for the next year or so. However, members observed that there was considerable uncertainty about mining investment beyond that period. In particular, changes in production and exports of energy commodities in other countries were making it more difficult to assess the potential for new projects in the gas sector in Australia. Overall, conditions in the business sector remained somewhat subdued, with survey measures for all industries at, or below, average levels.
Household spending appeared to have picked up early in 2013, after having slowed late in 2012 and having been supported by higher asset prices. In the March quarter, growth of retail sales volumes was strong across most categories, amid a decline in retail prices. Liaison suggested that the pace of retail spending might have eased somewhat more recently, while measures of consumer confidence fell back to around average levels in May.
Members observed that the effects of low interest rates had been evident in a range of housing market indicators. Building approvals for both higher-density and detached dwellings had increased over recent months. The Bank's liaison contacts were generally becoming more positive about the outlook for dwelling investment. Also, loan approvals had grown more strongly in recent months, including for new housing, and auction clearance rates were well above average in Sydney and had picked up to be a bit above average in Melbourne. While measures of dwelling prices had been relatively flat over recent months, they were still higher than the previous year.
Labour market conditions remained somewhat subdued. The monthly employment data continued to be volatile, with a large increase in employment in April following a sizeable decrease in March. Looking through this volatility, employment growth had not been as fast as growth of the labour force, which had led to the unemployment rate drifting higher over the past year, to 5½ per cent. Job advertisements had stabilised earlier in the year, but had edged down in recent months. Overall, leading indicators of employment pointed to continued moderate employment growth.
The wage price index had increased by 0.7 per cent in the March quarter, a little less than had been expected, and year-ended wage growth was below the average of the past decade. The easing in wage growth had been broad based across industries and states, with notable declines in areas related to the mining sector. While the decline in the pace of wage growth in recent quarters had been most pronounced in the private sector, growth in public sector wages continued to slow in the March quarter and remained relatively subdued, consistent with ongoing fiscal restraint.
What we see in general is a business sector split between natural resource and non-natural resource sectors. The former is in flux as a result of the Chinese re-balancing, while the latter is OK. Consumers are still spending thanks to the wealth effect of higher asset prices. The Central Bank also has room to lower rates further if needed.
Let's turn to a few Australian ETFs, starting with the equity markets.

Prices have dropped almost 20%, from their high of 28.15 to yesterday's close of 22.60/ Prices are now below the 200 day EMA; they've brought the shorter EMAs with them. Also note the slight increase in volume and negative MACD and CMF. Prices are right at the 38.2% Fib reading from the June-May rally.
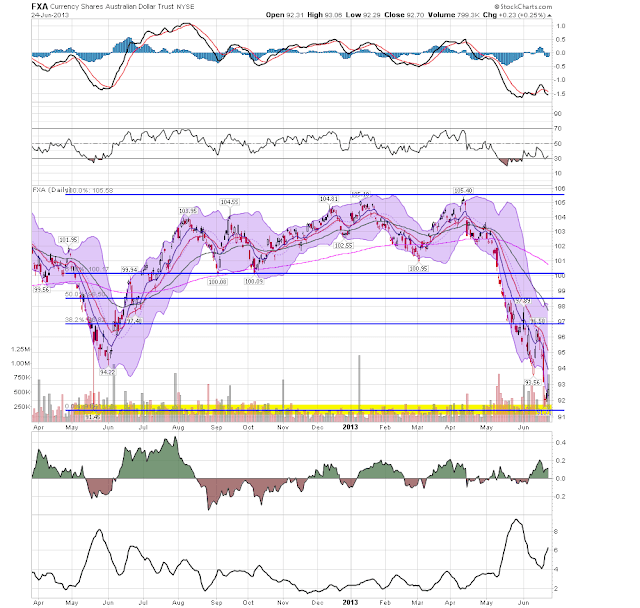
Like the equity markets, the Aussie dollar has also dropped sharply, falling about 12.66%. Like the equity market, the technicals are very negative. However, prices have made a 100% retracement from their May move last year, indicating this might be the end of the sell-off.
The Conference Board LEI for Australia increased in April for a fourth consecutive month, with money supply and stock prices making the largest positive contributions. Between October 2012 and April 2013, the leading economic index increased 0.7 percent (about a 1.5 percent annual rate), up from a decline of 0.4 percent (about a -0.8 percent annual rate) during the previous six months. Additionally, the strengths among the leading indicators have remained more widespread than the weaknesses in recent months.
Here is a copy of the components:


In general, we see a positive contribution from most components over the last 4-5 months with two exceptions: building approvals and the sales to inventory ratio. All other points are doing well. Let's now turn to the CEIs:

Like the LEIs, the CEIs are now printing mostly positive numbers.
Here's the assessment of the economy from the latest meeting minutes of the central bank:
Exports had grown further in the March quarter. Resources exports, particularly of bulk commodities, had grown strongly over the past year, while services exports had resumed growth more recently.
Available information indicated that business investment had declined in the March quarter. According to the latest ABS capital expenditure survey, the decline had been in both the mining and non-mining sectors. The fall in capital imports since the beginning of the year was consistent with a decline in investment in the first quarter, although recent data showed that capital imports had bounced back somewhat in April.
According to the ABS survey of firms' capital expenditure plans, non-mining investment was expected to show moderate growth over the next year or so. While the survey also continued to imply further growth in mining investment, in the past actual annual capital expenditure by mining companies had often differed by a wide margin from their forecasts as reflected in the ABS survey. Based on public statements by mining companies and information from the Bank's liaison, it seemed likely that mining investment was near its peak but would probably remain at a high level for the next year or so. However, members observed that there was considerable uncertainty about mining investment beyond that period. In particular, changes in production and exports of energy commodities in other countries were making it more difficult to assess the potential for new projects in the gas sector in Australia. Overall, conditions in the business sector remained somewhat subdued, with survey measures for all industries at, or below, average levels.
Household spending appeared to have picked up early in 2013, after having slowed late in 2012 and having been supported by higher asset prices. In the March quarter, growth of retail sales volumes was strong across most categories, amid a decline in retail prices. Liaison suggested that the pace of retail spending might have eased somewhat more recently, while measures of consumer confidence fell back to around average levels in May.
Members observed that the effects of low interest rates had been evident in a range of housing market indicators. Building approvals for both higher-density and detached dwellings had increased over recent months. The Bank's liaison contacts were generally becoming more positive about the outlook for dwelling investment. Also, loan approvals had grown more strongly in recent months, including for new housing, and auction clearance rates were well above average in Sydney and had picked up to be a bit above average in Melbourne. While measures of dwelling prices had been relatively flat over recent months, they were still higher than the previous year.
Labour market conditions remained somewhat subdued. The monthly employment data continued to be volatile, with a large increase in employment in April following a sizeable decrease in March. Looking through this volatility, employment growth had not been as fast as growth of the labour force, which had led to the unemployment rate drifting higher over the past year, to 5½ per cent. Job advertisements had stabilised earlier in the year, but had edged down in recent months. Overall, leading indicators of employment pointed to continued moderate employment growth.
The wage price index had increased by 0.7 per cent in the March quarter, a little less than had been expected, and year-ended wage growth was below the average of the past decade. The easing in wage growth had been broad based across industries and states, with notable declines in areas related to the mining sector. While the decline in the pace of wage growth in recent quarters had been most pronounced in the private sector, growth in public sector wages continued to slow in the March quarter and remained relatively subdued, consistent with ongoing fiscal restraint.
What we see in general is a business sector split between natural resource and non-natural resource sectors. The former is in flux as a result of the Chinese re-balancing, while the latter is OK. Consumers are still spending thanks to the wealth effect of higher asset prices. The Central Bank also has room to lower rates further if needed.
Let's turn to a few Australian ETFs, starting with the equity markets.

Prices have dropped almost 20%, from their high of 28.15 to yesterday's close of 22.60/ Prices are now below the 200 day EMA; they've brought the shorter EMAs with them. Also note the slight increase in volume and negative MACD and CMF. Prices are right at the 38.2% Fib reading from the June-May rally.

Like the equity markets, the Aussie dollar has also dropped sharply, falling about 12.66%. Like the equity market, the technicals are very negative. However, prices have made a 100% retracement from their May move last year, indicating this might be the end of the sell-off.
Subscribe to:
Posts (Atom)