Last week, the new head of the Reserve Bank of India issued his first policy statement, raising rates 25 basis points while reducing some of the extraordinary measures put into place over the last few months to halt currency outflows. While many news outlets reported this as a startling development, a sober look at the data would reveal this move was hardly controversial. First, while inflation dipped in the earlier part of the year (4%-6%), it has since been rising, approaching the higher levels (7%+) seen last year. Second, the head of the Bank is new, and he would want to establish his inflation fighting credentials for the markets specifically and the economy at large generally. Seen in the light of these two facts, the move should have been anticipated. For background on the India situation see these posts: here, here, here and here.
Here are some salient points from the points from the policy announcement:
On the domestic front, growth has weakened with continuing sluggishness in industrial activity and services. The pace of infrastructure project completion is subdued and new project starts remain muted. Consumption, while relatively firm so far, is starting to weaken even in rural areas, with durable goods consumption hit hard. Consequently, growth is trailing below potential and the output gap is widening. Some pick-up is expected on account of the brightening prospects for agriculture due to kharif output and the upturn in exports. Also, as infrastructure investments are expedited, and as projects cleared by the Cabinet Committee on Investment come on stream, growth could pick up in the second half of the year.
WPI inflation, which had eased in Q1 of 2013-14, has started rising again as the pass-through of fuel price increases has been compounded by the sharp depreciation of the rupee and rising international commodity prices. The negative output gap will exercise downward pressure on inflation, and the process will be aided as supply side constraints, especially relating to food and infrastructure, ease. However, the current assessment is that in the absence of an appropriate policy response, WPI inflation will be higher than initially projected over the rest of the year. What is equally worrisome is that inflation at the retail level, measured by the CPI, has been high for a number of years, entrenching inflation expectations at elevated levels and eroding consumer and business confidence. Although better prospects of a robust kharif harvest will lead to some moderation in CPI inflation, there is no room for complacency.
Showing posts with label India. Show all posts
Showing posts with label India. Show all posts
Friday, September 27, 2013
Wednesday, September 18, 2013
Recent Indian Bounce Looks Purely Technical

Over the last few weeks, the Indian market has rallied sharply. However, it appears to be a technical bounce for two reasons.
1.) Volume is low, and
2.) Prices have not broken through upside resistance (at least not yet).
Also consider that recent news about Indian inflation ties the central banks hands on policy:
The wholesale-price index rose 6.1 percent from a year earlier, compared with July’s 5.79 percent climb, the Commerce Ministry said in New Delhi today. The median estimate of 25 analysts in a Bloomberg News survey was for a 5.7 percent gain.


Wednesday, August 28, 2013
Will Emerging Market's Sliding Currency Become an International Crisis?
Over the last few months, India's problems have come home to roost. Their growth has dropped as the result of a bloated domestic government and rather draconian foreign investment rules. Their current account relative to GDP is large with little sign of getting smaller and inflation is still at uncomfortable levels, thereby boxing in the central bank. For more information, see here and here.
And the currency continues to slide:
Here's a chart of the rupee ETF that shows two recent breaks of support (see the blue arrow):

Also note the weak momentum and volume reading and very bearish EMA orientation.
And India is not alone in it's problems. The latest news out of Brazil is not encouraging.
First, we see the manufacturing sector's reading fell below 50, indicating a contraction:
Reflective of lower foreign business and total new orders, Brazilian manufacturers reduced their output in July. Subsequently, the PMI fell to a 13-month low, and indicated that the country’s manufacturing economy
deteriorated for the first time since September 2012. Meanwhile, the depreciation of the real reportedly resulted in higher prices paid for inputs, with the rate of cost inflation accelerating to the fastest in over three years and charge inflation picking up to the sharpest in five years.
The seasonally adjusted HSBC Brazil Purchasing Managers’ Index™ (PMI™) fell to its lowest reading in 13 months, posting 48.5 in July, down from 50.4 in the previous month. The latest reading indicated the first deterioration in manufacturing operating conditions across the country since September 2012. Four of the five PMI sub-indices negatively affected the
Here's a chart of the data:

The service sector output continues to fall, although it is currently on this side of an expansion:
The seasonally adjusted Services Business Activity Index fell from 51.0 in June to 50.3 in July. The latest reading was indicative of a marginal increase in
services output, and the joint-weakest in the current 11-month expansionary sequence. Slower rises in business activity were linked by panellists to weaker
gains in new work, an increasingly fragile economy and national protests.
And the country continues to have currency problems, which I first noted last week. In fact, their central banker had to forgo an appearance at the Fed's Jackson Hole retreat in order to implement a currency plan:
But with Brazil’s currency, the real, sinking rapidly against the dollar, he chose to stay at home, and on Thursday night launched one of the world’s most ambitious responses yet to the present market volatility – a $60bn currency intervention programme.
Let's take a look at the Brazilian real ETF:

The real has been dropping all summer. It fell through two key support levels in mid-June and again in mid-August (see blue arrows). Momentum has been weak for three months, the volume flow has been negative, volatility is high and the moving average picture is very weak.
Here's a chart comparing Brazil's currency ETF with India's; both show a similar recent slide.

And the currency continues to slide:
India’s
battered rupee was on track for its worst one-day fall in more than two
decades on Wednesday, plunging 3.4 per cent in morning trading to
breach Rs68 to the US dollar for the first time in a downbeat reaction
to a government plan to rescue the floundering economy.
Palaniappan Chidambaram, finance minister, on Tuesday outlined a
10-point scheme to reduce the nation’s current account deficit and
restore economic growth, responding to another day of sharp stock market
losses and currency decline. Here's a chart of the rupee ETF that shows two recent breaks of support (see the blue arrow):

Also note the weak momentum and volume reading and very bearish EMA orientation.
And India is not alone in it's problems. The latest news out of Brazil is not encouraging.
First, we see the manufacturing sector's reading fell below 50, indicating a contraction:
Reflective of lower foreign business and total new orders, Brazilian manufacturers reduced their output in July. Subsequently, the PMI fell to a 13-month low, and indicated that the country’s manufacturing economy
deteriorated for the first time since September 2012. Meanwhile, the depreciation of the real reportedly resulted in higher prices paid for inputs, with the rate of cost inflation accelerating to the fastest in over three years and charge inflation picking up to the sharpest in five years.
The seasonally adjusted HSBC Brazil Purchasing Managers’ Index™ (PMI™) fell to its lowest reading in 13 months, posting 48.5 in July, down from 50.4 in the previous month. The latest reading indicated the first deterioration in manufacturing operating conditions across the country since September 2012. Four of the five PMI sub-indices negatively affected the
Here's a chart of the data:


The service sector output continues to fall, although it is currently on this side of an expansion:
The seasonally adjusted Services Business Activity Index fell from 51.0 in June to 50.3 in July. The latest reading was indicative of a marginal increase in
services output, and the joint-weakest in the current 11-month expansionary sequence. Slower rises in business activity were linked by panellists to weaker
gains in new work, an increasingly fragile economy and national protests.
And the country continues to have currency problems, which I first noted last week. In fact, their central banker had to forgo an appearance at the Fed's Jackson Hole retreat in order to implement a currency plan:
But with Brazil’s currency, the real, sinking rapidly against the dollar, he chose to stay at home, and on Thursday night launched one of the world’s most ambitious responses yet to the present market volatility – a $60bn currency intervention programme.
Let's take a look at the Brazilian real ETF:

The real has been dropping all summer. It fell through two key support levels in mid-June and again in mid-August (see blue arrows). Momentum has been weak for three months, the volume flow has been negative, volatility is high and the moving average picture is very weak.
Here's a chart comparing Brazil's currency ETF with India's; both show a similar recent slide.

Wednesday, August 21, 2013
Indian Situation Continues To Deteriorate
The situation in India continues to deteriorate.
First, yields are spiking:
A surge in Indian sovereign debt costs to a 12-year high this week is threatening Prime Minister Manmohan Singh’s plan to cut the budget deficit and fueling the fastest surge in credit risk since 2008.
Ten-year (GIND10YR) yields rose 72 basis points this month through yesterday to 8.92 percent, the most among 14 regional markets tracked by Bloomberg, touched the highest level since 2001 of 9.48 percent. They plunged 57 basis points today after the Reserve Bank of India said late yesterday it will buy long-dated notes via open-market auctions. Government debt in Indonesia added 68 basis points to 8.39 percent.
In response, the Reserve Bank of India has gone into the market to buy bonds with the intended effect of lowering yields:
Late on Tuesday night the RBI announced that it would purchase Rs80bn ($1.2bn) of long-dated government bonds, along with other measures to ease pressures on banks, whose valuations have been badly hit by a series of measures introduced to protect the rupee over the past month.
The moves partially reversed previous tightening measures and led to accusations from analysts of policy “flip-flops”.
These moves have led to questions about the overall veracity of the RBIs policies:
First, yields are spiking:
A surge in Indian sovereign debt costs to a 12-year high this week is threatening Prime Minister Manmohan Singh’s plan to cut the budget deficit and fueling the fastest surge in credit risk since 2008.
Ten-year (GIND10YR) yields rose 72 basis points this month through yesterday to 8.92 percent, the most among 14 regional markets tracked by Bloomberg, touched the highest level since 2001 of 9.48 percent. They plunged 57 basis points today after the Reserve Bank of India said late yesterday it will buy long-dated notes via open-market auctions. Government debt in Indonesia added 68 basis points to 8.39 percent.
In response, the Reserve Bank of India has gone into the market to buy bonds with the intended effect of lowering yields:
Late on Tuesday night the RBI announced that it would purchase Rs80bn ($1.2bn) of long-dated government bonds, along with other measures to ease pressures on banks, whose valuations have been badly hit by a series of measures introduced to protect the rupee over the past month.
The moves partially reversed previous tightening measures and led to accusations from analysts of policy “flip-flops”.
These moves have led to questions about the overall veracity of the RBIs policies:
“Over in India,
flip-flops by policy makers continue,” Rajeev Malik, senior
Asia-Pacific economist at brokerage CLSA, wrote in a note. “The latest
moves by the RBI are aimed at cleaning up the unintended mess in the
bond market from their convoluted and ineffective currency defence. But
they still appear unsure of what [growth, rupee, bonds] they want to
eventually save.”
Developing Market Currencies Dropping Sharply
India is in a very difficult position, as it seems that several major macro-level economic problems are coming to a boil.

First, they have a large current account deficit, which is having an overall negative impact on the rupees value.

Secondly, inflationary pressures -- while lower -- are still cropping up underneath the surface. To stem both of these problems, the central bank would normally raise interest rates. However, overall economic growth has been dropping as well, hemming in the Central Bank.
Brazil is another developing country that has a very difficult economic environment. Growth is slowing
 while the inflation rate remains elevated:

All of these problems are starting to come to a head in the respective ETF charts of these currencies:


Both are weekly charts.
The rupee ETF (top chart) has fallen through support at the 19.5 level and is currently trading near three year lows. Momentum is negative, as is the volume flow. Prices are pulling the shorter EMAs lower.
The real ETF has the same technical profile, except with different support levels, with its occurring right about 18 and 17.

First, they have a large current account deficit, which is having an overall negative impact on the rupees value.

Secondly, inflationary pressures -- while lower -- are still cropping up underneath the surface. To stem both of these problems, the central bank would normally raise interest rates. However, overall economic growth has been dropping as well, hemming in the Central Bank.
Brazil is another developing country that has a very difficult economic environment. Growth is slowing


All of these problems are starting to come to a head in the respective ETF charts of these currencies:


Both are weekly charts.
The rupee ETF (top chart) has fallen through support at the 19.5 level and is currently trading near three year lows. Momentum is negative, as is the volume flow. Prices are pulling the shorter EMAs lower.
The real ETF has the same technical profile, except with different support levels, with its occurring right about 18 and 17.
Thursday, August 8, 2013
Market/Econoimc Analysis: India; Still in Questionable Shape For New Central Bank Head


The above five charts show the central problems facing the India economy. The biggest is a declining GDP growth rate (top chart). The annual rate of growth has slowed from 9.4% in 2010 to 4.8% in the latest reading. In this situation, one would expect the Reserve Bank of India to lower interest rates, which they have done as shown in the second chart. However the downward movement of rates is clearly limited by inflation (third chart). While that has dropped from readings between 7% and 8% for most of the last year to recent reading of just shy of 5%, the level is still high. Just as importantly, the rupee has dropped sharply over the part three months (fourth chart), which has led the Indian Central Bank to take extraordinary actions and also limits the ability to lower rates to stimulate the economy. And finally, there is the increasing current account deficit (fifth chart), which has been increasing as a percent of GDP -- a statistic that further contains central bank action.
It is this world that the new head of India's Central Bank walks into. Perhaps the bast thing about him is we wrote the paper which questioned the overall impact of financial liberalization and deregulation that led Larry Summers to label him a luddite. I don't envy his job given the above.
Let's take a look at the ETFs:

The Indian ETF had support at ~52, 54 and 56 over the last years -- levels which prices fell through over the last two months. After the initial break, prices ralled to the 200 day EMA, only to it resistance and fall back to the 50 level. Notice the higher volume of the most recent sell-off, along with the EMA drop and weak CMF reading. This is a very weak market, with a price target of at least 45.

The weekly chart of the rupee shows that prices are now at long-term, multi-year support. Last week, prices moved through support, only to bounce back.
This is still an economy that is trying to find its feet. I'd be more a seller than a buyer here.
Thursday, June 27, 2013
Market/Economic Analysis: India
last week, the Indian ETF lost nearly 6% in the emerging market sell-off. As I've noted previously, I'm bearish on the economy (see also here). Let's look at the latest Central Bank policy statement to get an overview of the current economic environment.
In May, the Central Statistics Office (CSO) reported India’s GDP growth in Q4 of 2012-13 of 4.8 per cent, a marginal improvement over the previous quarter. During the current financial year, the growth of industrial production decelerated to 2.3 per cent in April after picking up in the preceding month. All constituent categories of industry have slowed, with a persistent contraction in mining activity. The sharp weakening in the growth of capital goods production points to still damped investment demand whereas a pick-up in consumer non-durables could be indicative of a fragile return of consumer confidence. On the other hand, the services sector purchasing managers’ index rose in May on order flows. The onset of the south-west monsoon has been strong and on time.
Let's place this slowdown into historical perspective:
 The economy has definitely slowed from a 9% annual growth rate to 4.8% -- nearly a halving in output. For a country that is trying to life hundreds of millions out of poverty, that is the wrong direction.
Headline WPI inflation eased for three months in succession with the May reading at 4.7 per cent, down from an average of 7.4 per cent in 2012-13. All constituent categories, barring food, have moderated. In the fuel category, coal and mineral oil prices declined, partly offsetting the upward revision in administered prices of electricity. Non-food manufactured products inflation too ebbed, driven by metal prices which fell for the eighth successive month in response to softening of global prices. Still elevated food inflation, particularly in respect of cereals and vegetables, sustained upside pressures on overall inflation. Retail inflation, as measured by the new combined (rural and urban) CPI, edged down from an average of 10.2 per cent last fiscal year to 9.3 per cent in May.

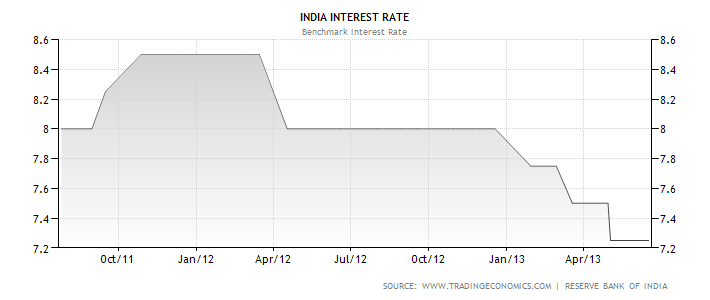
This is one piece of good news: over the last three months there has been a marked drop in the inflation rate. This may allow them to lower rates further:
 However, let's not get too excited about growth prospects just yet. India has done little to nothing to alter their primary problems: a dilapidated infrastructure system, poor political environment, high budget deficit and current account deficit.
Let's turn to the market.

The Indian ETF was trading in a range between ~55 and ~62 for a period of 8 months. Prices broke through support at the 56 level in early June and have been moving lower since. Notice the two gaps lower on the chart, indicating big volume moves lower. Now the shorter EMAs have moved through the 200 day EMA, with negative momentum and CMF readings.
In May, the Central Statistics Office (CSO) reported India’s GDP growth in Q4 of 2012-13 of 4.8 per cent, a marginal improvement over the previous quarter. During the current financial year, the growth of industrial production decelerated to 2.3 per cent in April after picking up in the preceding month. All constituent categories of industry have slowed, with a persistent contraction in mining activity. The sharp weakening in the growth of capital goods production points to still damped investment demand whereas a pick-up in consumer non-durables could be indicative of a fragile return of consumer confidence. On the other hand, the services sector purchasing managers’ index rose in May on order flows. The onset of the south-west monsoon has been strong and on time.
Let's place this slowdown into historical perspective:

Headline WPI inflation eased for three months in succession with the May reading at 4.7 per cent, down from an average of 7.4 per cent in 2012-13. All constituent categories, barring food, have moderated. In the fuel category, coal and mineral oil prices declined, partly offsetting the upward revision in administered prices of electricity. Non-food manufactured products inflation too ebbed, driven by metal prices which fell for the eighth successive month in response to softening of global prices. Still elevated food inflation, particularly in respect of cereals and vegetables, sustained upside pressures on overall inflation. Retail inflation, as measured by the new combined (rural and urban) CPI, edged down from an average of 10.2 per cent last fiscal year to 9.3 per cent in May.

This is one piece of good news: over the last three months there has been a marked drop in the inflation rate. This may allow them to lower rates further:
Let's turn to the market.

The Indian ETF was trading in a range between ~55 and ~62 for a period of 8 months. Prices broke through support at the 56 level in early June and have been moving lower since. Notice the two gaps lower on the chart, indicating big volume moves lower. Now the shorter EMAs have moved through the 200 day EMA, with negative momentum and CMF readings.
Thursday, June 6, 2013
Market/Economic Analysis: India
Like it's BRICs cousin Brazil, India is facing some fairly heavy problems. I last discussed the Indian economy in April and noted they were not looking very promising. First, they are dealing with slower growth and higher inflation. But structural problems are now coming to the surface. First, their infrastructure is in terrible shape and is now biting into growth:
“We used to think roads were the most important thing,” one government minister confided this week at a reception. “But it’s power, power, power.”
Economists who study the Indian economy – which has probably just overtaken Japan to become the world’s third largest measured by purchasing power parity, according to the Organisation for Economic Co-operation and Development – say that one of its peculiar weaknesses is the small size of its manufacturing sector.
And the government is struggling with questions about its overall legitimacy as allegations of corruption and graft continue:
Indian Prime Minister Manmohan Singh’s latest skirmish with corruption risks setting back efforts to spur growth, worsening a legislative logjam under a government set to pass the fewest bills ever in a full term.
Singh, 80, is grappling with renewed allegations that he has allowed corruption to fester after separate graft probes led to the May 10 dismissal of the law and railways ministers. Parliament ended two days early last week as opposition parties demanding the men’s resignation blocked proceedings, with proposals to open up the country’s pension and insurance industries to overseas investment still stalled.
.....
Over the last four years, at least six ministers have resigned after being accused in corruption cases, with the opposition parties claiming this is the most graft-ridden government in India’s history.
Both of these factors -- along with the general global slowdown -- is leading to slower GDP growth. From the latest GDP report:
GDP at factor cost at constant (2004-05) prices in the year 2012-13 is now estimated at Rs. 55,05, 437 crore (as against Rs. 55,03,476 crore estimated earlier on 7th February, 2013), showing a growth rate of 5.0 percent over the First Revised Estimates of GDP for the year 2011-12 of Rs. 52,43,582 crore, released on 31th January 2013.
.....
Growth rates in various sectors are as follows: ‘agriculture, forestry and fishing’ (1.4 percent), ‘mining and quarrying’ (-3.1 percent), ‘manufacturing’ (2.6 percent), ‘electricity, gas and water supply’ (2.8 percent) ‘construction’ (4.4 percent), 'trade, hotels, transport and communication' (6.2 percent), 'financing, insurance, real estate and business services' (9.1 percent), and 'community, social and personal services' (4.0 percent).
News stories have noted that the combined effect of a weakened central government, high budget deficit and overall beaurocratic inefficiency are hindering growth:
Singh’s eight-month push to boost the economy has in recent weeks floundered as protests over alleged graft in government disrupted parliament, impeding bills seeking to lure foreign capital, simplify taxes and provide more land for industry. At the same time, a record current-account deficit is constraining Indian monetary easing as the global recovery falters.
“Growth is weak and I am skeptical about a sharp bounce-back anytime soon,” said Radhika Rao, an economist at DBS Bank Ltd. in Singapore. “The Reserve Bank of India will be cautious about retail inflation and the high current-account deficit.”
The central bank also believes the Indian economy is in weak shape:
On the domestic front, most Members were of the view that the overall demand situation is very weak. Industrial growth is subdued - new orders are expanding only modestly and instances have been reported where even after placing orders, clients are advising manufacturers not to deliver goods. Downgrading of companies by rating agencies has gone up by 30 per cent. The services sector is also weak and productivity in services and manufacturing sectors has been adversely affected, leading to supply constraints. The supply response is low, notwithstanding sizable unutilized capacity in the economy. Profit margins have been squeezed due to minimum wages rising with consequent wage pressures in the organized sector.
For a more detailed look, see this link from the central bank.
The latest Markit manufacturing and service report do paint a picture of an economy that is growing, albeit barely in the case of manufacturing.
Firs is the manufacturing report:
Operating conditions in the Indian manufacturing economy stagnated during May. The seasonally adjusted HSBC Purchasing Managers’ Index™ (PMI™) – an indicator derived from individual diffusion indices measuring changes in output, new orders, employment, suppliers’ delivery times and stocks of purchases – fell from 51.0 in April to 50.1 and was at a 50-month low.
Reflective of weaker gains in incoming new work and persistent power outages, output decreased in May, the first decline registered since March 2009. That said, production fell only slightly. Order book volumes rose for the fiftieth consecutive month. The rate of expansion was, however, marginal and the slowest in that sequence. Panellists suggested that demand was maintained, but commented on increased competition for new work and tough market conditions overall, particularly at home. Encouragingly, foreign orders rose at an accelerated pace during May. Growth in export business was solid and the fastest since January. Monitored companies indicated strengthening demand from key export clients. Meanwhile, unfinished business levels increased, amid evidence of power and water shortages. Backlogs of work rose solidly and at the quickest pace in five months.
And then there is the services report, which was more bullish:
The seasonally adjusted HSBC Services Business Activity Index posted 53.6 in May, up from 50.7, pointing to a solid expansion in output, one that was the fastest in three months. This contrasted with a fall registered in manufacturing output, the first decline in 50 months. May data pointed to higher levels of new work placed at private sector firms in India. The rate of expansion was moderate and little-changed from April. Service providers stated that demand was stronger and new products were launched. Manufacturers reported weaker gains in incoming new work, tough market conditions and increased competition.
Let's turn to the charts of the Indian ETF

The ETF is still trading between the 55 and 62 lever. Momentum is fluctuating and prices are using the 200 day EMA line as technical support.
The main issue for the market is when will it break out of its range and what direction will it move in?
“We used to think roads were the most important thing,” one government minister confided this week at a reception. “But it’s power, power, power.”
Economists who study the Indian economy – which has probably just overtaken Japan to become the world’s third largest measured by purchasing power parity, according to the Organisation for Economic Co-operation and Development – say that one of its peculiar weaknesses is the small size of its manufacturing sector.
And the government is struggling with questions about its overall legitimacy as allegations of corruption and graft continue:
Indian Prime Minister Manmohan Singh’s latest skirmish with corruption risks setting back efforts to spur growth, worsening a legislative logjam under a government set to pass the fewest bills ever in a full term.
Singh, 80, is grappling with renewed allegations that he has allowed corruption to fester after separate graft probes led to the May 10 dismissal of the law and railways ministers. Parliament ended two days early last week as opposition parties demanding the men’s resignation blocked proceedings, with proposals to open up the country’s pension and insurance industries to overseas investment still stalled.
.....
Over the last four years, at least six ministers have resigned after being accused in corruption cases, with the opposition parties claiming this is the most graft-ridden government in India’s history.
Both of these factors -- along with the general global slowdown -- is leading to slower GDP growth. From the latest GDP report:
GDP at factor cost at constant (2004-05) prices in the year 2012-13 is now estimated at Rs. 55,05, 437 crore (as against Rs. 55,03,476 crore estimated earlier on 7th February, 2013), showing a growth rate of 5.0 percent over the First Revised Estimates of GDP for the year 2011-12 of Rs. 52,43,582 crore, released on 31th January 2013.
.....
Growth rates in various sectors are as follows: ‘agriculture, forestry and fishing’ (1.4 percent), ‘mining and quarrying’ (-3.1 percent), ‘manufacturing’ (2.6 percent), ‘electricity, gas and water supply’ (2.8 percent) ‘construction’ (4.4 percent), 'trade, hotels, transport and communication' (6.2 percent), 'financing, insurance, real estate and business services' (9.1 percent), and 'community, social and personal services' (4.0 percent).
News stories have noted that the combined effect of a weakened central government, high budget deficit and overall beaurocratic inefficiency are hindering growth:
Singh’s eight-month push to boost the economy has in recent weeks floundered as protests over alleged graft in government disrupted parliament, impeding bills seeking to lure foreign capital, simplify taxes and provide more land for industry. At the same time, a record current-account deficit is constraining Indian monetary easing as the global recovery falters.
“Growth is weak and I am skeptical about a sharp bounce-back anytime soon,” said Radhika Rao, an economist at DBS Bank Ltd. in Singapore. “The Reserve Bank of India will be cautious about retail inflation and the high current-account deficit.”
The central bank also believes the Indian economy is in weak shape:
On the domestic front, most Members were of the view that the overall demand situation is very weak. Industrial growth is subdued - new orders are expanding only modestly and instances have been reported where even after placing orders, clients are advising manufacturers not to deliver goods. Downgrading of companies by rating agencies has gone up by 30 per cent. The services sector is also weak and productivity in services and manufacturing sectors has been adversely affected, leading to supply constraints. The supply response is low, notwithstanding sizable unutilized capacity in the economy. Profit margins have been squeezed due to minimum wages rising with consequent wage pressures in the organized sector.
For a more detailed look, see this link from the central bank.
The latest Markit manufacturing and service report do paint a picture of an economy that is growing, albeit barely in the case of manufacturing.
Firs is the manufacturing report:
Operating conditions in the Indian manufacturing economy stagnated during May. The seasonally adjusted HSBC Purchasing Managers’ Index™ (PMI™) – an indicator derived from individual diffusion indices measuring changes in output, new orders, employment, suppliers’ delivery times and stocks of purchases – fell from 51.0 in April to 50.1 and was at a 50-month low.
Reflective of weaker gains in incoming new work and persistent power outages, output decreased in May, the first decline registered since March 2009. That said, production fell only slightly. Order book volumes rose for the fiftieth consecutive month. The rate of expansion was, however, marginal and the slowest in that sequence. Panellists suggested that demand was maintained, but commented on increased competition for new work and tough market conditions overall, particularly at home. Encouragingly, foreign orders rose at an accelerated pace during May. Growth in export business was solid and the fastest since January. Monitored companies indicated strengthening demand from key export clients. Meanwhile, unfinished business levels increased, amid evidence of power and water shortages. Backlogs of work rose solidly and at the quickest pace in five months.
And then there is the services report, which was more bullish:
The seasonally adjusted HSBC Services Business Activity Index posted 53.6 in May, up from 50.7, pointing to a solid expansion in output, one that was the fastest in three months. This contrasted with a fall registered in manufacturing output, the first decline in 50 months. May data pointed to higher levels of new work placed at private sector firms in India. The rate of expansion was moderate and little-changed from April. Service providers stated that demand was stronger and new products were launched. Manufacturers reported weaker gains in incoming new work, tough market conditions and increased competition.
Let's turn to the charts of the Indian ETF

The ETF is still trading between the 55 and 62 lever. Momentum is fluctuating and prices are using the 200 day EMA line as technical support.
The main issue for the market is when will it break out of its range and what direction will it move in?
Friday, April 5, 2013
Market Analysis: India -- Not Looking Promising

The weekly Indian ETF chart shows that for the last year, prices have been trading in a range between roughly 47.5 and 62.5 -- a range of about 30%. Most importantly, the rally chart started last May has been broken; prices are slow below the 200 week EMA on declining momentum and lowering participation.

On the daily chart, we see that prices have recently been trading between the 56 and 62.5 levels. However, technically we see a declining MACD and weakening CMF. Also note that prices are just below the 200 day EMA on this chart as well.
I've been bearish on India this year (see here, here and here).
Overall, in the links above we see some fairly entrenched problems such as extreme policy uncertainly, inflation, lowered growth, and large budgetary and current account deficits.
The latest Markit Manufacturing report is good, but there are underlying concerns:
Indian manufacturing business conditions continued to improve in March, but persistent powercuts weighed on growth. Moreover, the volume of incoming new work increased moderately and at the slowest pace in 16 months. Export orders expanded slightly, with the rate of growth easing to the slowest in seven months.
The seasonally adjusted HSBC Purchasing ManagersIndex™ (PMI™) – a composite indicator designed to give a single-figure snapshot of operating conditions in the manufacturing economy – posted 52.0 in March (down from 54.2 in February), indicating an improvement in overall business conditions. However, the PMI was down to the lowest reading in 16 months.
March data signalled higher volumes of incoming new work in the Indian goods-producing sector. Growth in total new orders was, however, only moderate and the slowest in 16 months. Export orders rose slightly with the rate of expansion also easing. Output increased modestly, as persistent power shortages hampered
production. The pace of growth was the slowest in 16 months.
The key thread running through the above report is that things are good, but they are at their lowest reading in 16 months. Here is a chart of the data:

Turning to the services index, we see the following:
Output in the Indian private sector rose during March, extending the current expansionary sequence to 47 months. However, the HSBC India Composite Output Index fell from 54.8 in February to 51.4 indicating that activity increased slightly, and at the slowest pace in 17 months. Output growth eased across both the manufacturing and service sectors.
After adjusting for seasonal factors, the headline HSBC Services Business Activity Index registered 51.4 in March, down from 54.2 in February, signalling a further monthly expansion of services output. That said, the latest increase in business activity was only slight as new business growth eased. Moreover, the index posted well below the long-run series average (57.2).
As with the manufacturing numbers, we see some good data points. However, and again, we see the phrase lowest in 17 months.
Last week the Reserve Bank of India lowered its interest rate 25 basis points. Here are some salient points from that release:
4. India’s GDP growth in Q3 of 2012-13, at 4.5 per cent, was the weakest in the last 15 quarters. What is worrisome is that the services sector growth, hitherto the mainstay of overall growth, has also decelerated to its slowest pace in a decade. While overall industrial production growth turned positive in January, capital goods production and mining activity continued to contract. The composite purchasing managers’ index (PMI) declined in February, largely reflecting slower expansion in services. In the agriculture sector, the second advance estimates of kharif production indicate a decline in relation to the level last year. However, that may be offset, at least partly, by the rabi output for which sowing has been satisfactory.
Fiscal Situation
7. The Union Budget for 2013-14 has made a firm commitment to fiscal consolidation. According to the revised budget estimates for 2012-13, the gross fiscal deficit (GFD)-GDP ratio, at 5.2 per cent, was contained around its budgeted level, mainly by scaling down plan and capital expenditures. The GFD-GDP ratio is programmed to decline to 4.8 per cent in 2013-14 and further down to 3.0 per cent by 2016-17, in line with the revised road map for fiscal consolidation.
External Sector
8. With merchandise exports recording positive growth for the second successive month in February and non-oil imports contracting, the trade deficit narrowed significantly. For April-February 2012-13, however, the trade deficit was higher than its level a year ago with adverse implications for the current account deficit (CAD), already at a record high. Although capital inflows, mainly in the form of portfolio investment and debt flows, provided adequate financing, the growing vulnerability of the external sector to abrupt shifts in sentiment remains a key concern.
The outlook is not promising:
11. The Central Statistics Office (CSO) has projected GDP growth for 2012-13 of 5.0 per cent, lower than the Reserve Bank’s baseline projection of 5.5 per cent set out in the TQR, reflecting slower than expected growth in both industry and services. Key to reinvigorating growth is accelerating investment. The government has a critical role to play in this regard by remaining committed to fiscal consolidation, easing the supply bottlenecks and improving governance surrounding project implementation.
12. On the inflation front, some softening of global commodity prices and lower pricing power of corporates domestically is moderating non-food manufactured products inflation. However, the unrelenting rise in food inflation is keeping headline wholesale price inflation above the threshold level and consumer price inflation in double digits. Also, there is still some suppressed inflation related to administered prices which carries latent inflationary pressures. All this complicates the task of inflation management and underscores the imperative of addressing supply constraints. From an inflation perspective, upward revisions in the minimum support prices (MSP) should warrant caution in view of their implications for overall inflation.
Despite the strong reading from both the manufacturing and service sectors, there are serious structural problems. Inflation is too high, limiting the policy options available to the central bank. The government is very difficult to work with, the power infrastructure is in terrible shape and there are two large deficits -- budgetary and current account.
Thursday, February 1, 2007
S&P Upgrades India's Credit Status
From the Financial Times:
India is looking more and more like the next big growth play -- the same way China was a few years ago.
India finally regained full investment-grade status on Tuesday after a hiatus of more than 15 years, as Standard & Poor’s followed the lead of Moody’s and Fitch in removing the speculative tag from its sovereign credit rating.
The upgrade is symbolic for reformers in the government. S&P had downgraded India’s sovereign rating to junk status in May 1991, during the balance of payments crisis that triggered the start of the reform era.
India is looking more and more like the next big growth play -- the same way China was a few years ago.
Subscribe to:
Posts (Atom)