Monday, June 17, 2013

Rational Expectations Theory Debunked in a Minute


Barry had this up on his blog over the weekend.  It is one of the best economic lectures I have ever seen.  Blyth is brilliant, funny and deeply irreverent.

The lecture is a little over 50 minutes and worth every minute of your time.

Here's his explanation of the the "confidence fairy" which is from the video starting at about 45 minutes.


This is the confidence fairy thing,


Imagine the economy is falling around your ears; you don’t know if you’re going to have a job tomorrow, your partner is already unemployed, you really don’t know about the future, but you really worry about the debt, you just lie awake all night worrying about the debt as people do,


So the government credibly signals that it’s going to massively cut government expenditures and what you do using your rational expectations that are built into your head – well you know the true structural form of the equation governing the economy and the value of the co-efficients therein – big assumption, but put that to one side – you calculate your lifetime budget and lifetime expenditures in relation to the fact that twenty years from now that because of these state spending cuts now you’ll pay less taxes then.  Thereby you can retrodect how much extra money you’ve got now and everybody goes to Ikea and buys a couch and that cures the recession. 


I am not making this shit up.


Market/Economic Analysis: US

First, let's review last week's economic news:

The Good:

First, import prices declined: Prices for U.S. imports declined 0.6 percent in May, the U.S. Bureau of Labor Statistics reported today, after a 0.7 percent drop the previous month. Falling fuel and nonfuel prices contributed to the decreases in both months. U.S. export prices fell 0.5 percent in May following declines of 0.7 percent in April and 0.5 percent in March.  What's interesting here is that non-fuel imports have also been dropping.

Retail sales increased .6%: The U.S. Census Bureau announced today that advance estimates of U.S. retail and food services sales for May, adjusted for seasonal variation and holiday and trading-day differences, but not for price changes, were $421.1 billion, an increase of 0.6 percent (±0.5%) from the
previous month, and 4.3 percent (±0.7%) above May 2012. Total sales for the March through May 2013 period were up 3.7 percent (±0.5%)
from the same period a year ago. The March to April 2013 percent change was unrevised from 0.1 percent (±0.3%)*. 


This is by far the best news of the week.  With manufacturing slowing consumers will have to provide more economic activity to keep the economy moving forward.  This report indicates they're more than up to the task.  Equally impressive was the .3% increase ex-autos. 


Neutral

Producer prices are right on the edge of being a concern for a one-month print. The Producer Price Index for finished goods rose 0.5 percent in May, seasonally adjusted, the U.S. Bureau of Labor Statistics reported today. Prices for finished goods fell 0.7 percent in April and 0.6 percent in March. At the earlier stages of processing, prices received by manufacturers of intermediate goods declined 0.1 percent in May, and the crude goods index advanced 2.2 percent. On an unadjusted basis, prices for finished goods moved up 1.7 percent for the 12 months ended May 2013. 

Regarding PPI, most of the increases are due to large movements of single products that make up an index.  For example, fuel prices account for 60% of the increase in finished goods while a 41.6% increase in egg prices is responsible for over 60% of the increase in finished consumer foods.  Also note that 2/3 of the increased in the finished core prices are attributable to a .4% increase in light trucks and autos.  It's entirely likely that the prices related to eggs and autos are one-off events.  Energy is a bit more volatile, but there isn't much demand pull or price push pressure right now. 

There is no way anyone can say that inflation is an issue or even a potential issue in the current environment.  However, bigger moves in a single month's print of an inflation statistics is something to keep your eye on going forward.

Industrial Production was unchanged: Industrial production was unchanged in May after having decreased 0.4 percent in April. In May, manufacturing production rose 0.1 percent after falling in each of the previous two months, and the output at mines increased 0.7 percent. The gains in manufacturing and mining were offset by a decrease of 1.8 percent in the output of utilities. At 98.7 percent of its 2007 average, total industrial production in May was 1.6 percent above its year-earlier level. The rate of capacity utilization for total industry edged down 0.1 percentage point to 77.6 percent, a rate 0.2 percentage point below its level of a year earlier and 2.6 percentage points below its long-run (1972–2012) average.  

The good news is the print wasn't negative.  The bad news it the print was just barely good.  And the .1% overall increase in manufacturing -- especially on the heels of two straight contractions -- is pretty concerning.  It does appear that external events like the global slowdown and the sequester are starting to take a bigger bite out of manufacturing.

The Bad 

US Export prices dropped: U.S. export prices fell 0.5 percent in May following declines of 0.7 percent in April and 0.5 percent in March.  Lack of pricing pressure indicates that exporters may be under profit margin pressure over the next 3-6 months.

Let's turn to the charts.


The daily chart (top chart) shows that prices are using the trend line connecting the early January and mid-April lows as technical support.  The high from early April in the 159-160 and 50 area is providing support as tell.  The technicals are bearish: the shorter EMAs are entangled with prices, while the MACD and CMF is declining.

The top chart is the 60 minute prices chart and shows that prices are consolidating in a triangle pattern.


The big story in the bond market -- and all markets at large -- is when will the Fed start to taper off its bond buying program.  Last week, there was an emerging concensus it would be soon -- leading to the sell-off in the bond markets.  However, traders started to change their minds about that assessment, leading the bell of the treasury curve to rally above resistance.  As it stands right now, the IEIs still have support at 122 and the IEFs at 105.


The dollar has broken support at the 38.2% Fib level with the new price target of ~21.5.  Any rally will hit resistance at the 10, 20 and 200 day EMAs as well as the 38.2% Fib level.

Market outlook for the week: slightly negative.  The dollar's drop indicates that traders are short-term bearish on the US, which is confirmed by Treasuries inability to make a sustained move below support. 

Saturday, June 15, 2013

Weekly Indicators: interest rates warning edition


 - by New Deal democrat

May monthly data reported this past week included industrial production, which was flat, and capacity utilization, which declined. Retail sales, on the other hand, increased sharply again. Producer prices increased, due mainly to gasoline. Consumer confidence as to the present declined, but future expectations, a leading indicator, increased significantly.

Let's start this week's look at the high frequency weekly indicators with the recent activity in interest rates:

Interest rates and credit spreads
  •  4.99% BAA corporate bonds up +0.09%

  • 2.12% 10 year treasury bonds down -0.02%

  • 2.87% credit spread between corporates and treasuries up +0.11%
Interest rates for corporate bonds had generally been falling since being just above 6% in January 2011, hitting a low of 4.46% in November 2012. Treasuries established a 2% high in late 2011, falling to a low of 1.47% in July 2012. Spreads have varied between a high over 3.4% in June 2011 to a low under 2.75% in October 2012. In the last month interest rates have backed up steeply, but until the last two weeks spreads were falling to almost a new low.

Employment metrics

American Staffing Association Index
  • 92 unchanged w/w, down -0.1% YoY
Initial jobless claims
  •   334,000 down -12,000

  •   4 week average 345,250 down -7250
Tax Withholding
  • $70.7 B for the first 9 days of June vs. $67.0 B last year, up +3.7 B or +5.5%

  • $146.4 B for the last 20 reporting days vs. $136.9 B last year, up $9.5 B or +6.9%
In the last month, the ASA has deteriorated to being negative compared with last year. After having a great 20-day comparison two weeks ago, for the second time in a row this week tax withholding had close to its worst YoY comparison in several months. Initial claims remain within their recent range of between 325,000 to 375,000.

Transport

Railroad transport from the AAR
  • -7800 or -2.8% carloads YoY

  • +100 or +0.1% carloads ex-coal

  • +6300 or +2.5% intermodal units

  • -1600 or -0.3% YoY total loads
Shipping transport Rail transport has had four negative weeks in the last several months. This week was mixed.  The Harpex index has been improving slowly from its January 1 low of 352. The Baltic Dry Index remains above its recent low and increased smartly this week.

Consumer spending Gallup's YoY comparisons remain extremely positive, as they have been for the last half a year.  The ICSC varied between +1.5% and +4.5% YoY in 2012, while Johnson Redbook was generally below +3%.

Housing metrics

Housing prices
  • YoY this week +7.2%
Housing prices bottomed at the end of November 2011 on Housing Tracker, and averaged an increase of +2.0% to +2.5% YoY during 2012. This weeks's YoY increase made yet another 6 year record.

Real estate loans, from the FRB H8 report:
  • -0.2% w/w

  • up +0.1% YoY

  • +2.3% from its bottom
Loans turned up at the end of 2011 and averaged about 1% gains YoY through most of 2012.  In the last several months the comparisons have completely stalled.

Mortgage applications from the Mortgage Bankers Association:
  • +5% w/w purchase applications

  • +6% YoY purchase applications

  • +5% w/w refinance applications
Although they rose this week, refinancing applications have decreased sharply in the last month due to higher interest rates, but purchase applications continue their slightly rising trend established earlier this year.

Money supply

M1
  • +3.4% w/w

  • +1.2% m/m

  • +12.6% YoY Real M1

M2
  • +0.2% w/w

  • +0.3% m/m

  • +5.9% YoY Real M2
Real M1 made a YoY high of about 20% in January 2012 and had generally been easing off since, but recently has increased again.  Real M2 also made a YoY high of about 10.5% in January 2012.  Its subsequent low was 4.5% in August 2012. It has increased slightly in the last few months and has stabilized since.

Oil prices and usage
  •  Oil $97.85 up $1.82 w/w

  • Gas $3.66 up +$0.01 w/w

  • Usage 4 week average YoY -0.4%
The price of a gallon of gas, after declining sharply in March and April, rose again in May, and has steadied in the last couple of weeks. The 4 week average for gas usage remained slightly negative.

Bank lending rates The TED spread is still near the low end of its 3 year range.  LIBOR has made a 3 year low.

JoC ECRI Commodity prices
  • down -1.37 to 123.45 w/w

  • +7.03 YoY
This week we again have the pattern of gradual deterioration that began in February. But checking one year ago today, I see that we were in the midst of our summer swoon, nearly at contraction. This week indicators were certainly mixed but not flashing any imminent danger signs.

Once again temp staffing is becoming a larger concern as it declined again and remains below last year's rate. This week it was joined by the worst possible combination of interest rate moves - declining treasury rates vs. increasing corporate rates - which is what I would expect to see on the cusp of a recession. Because spreads were neear 12 month lows in the last few weeks, we don't have that signal yet. Real estate loans and commodities were neutral. Gas usage remains negative but may continue to reflect increased efficiency. Gas prices increased significantly but we haven't moved into a constrictive price range yet. This week like last week tax withholding had its worst comparison in months. Rail was mixed, up or down slightly depending on whether you include or exclude coal shipments.

The biggest positive remains very strong consumer spending. Jobless claims remain positive as well. More positives included house prices, YoY purchase mortgage applications, money supply, and overnight bank rates.

For the third week in a row, the message for me remains that if the data were actually rolling over, I would want to see a sustained increase in jobless claims and a sustained deterioration in consumer spending. That still isn't happening.

Have a nice weekend.

Friday, June 14, 2013

Weekend Weimar, Beagle and Pit Bull

It's that time o' the week.  I'll be back on Monday; NDD will be here tomorrow.

Until then ...


What Is the "Shadow Insurance" Industry?


     Over the last month, international tax planning and captive insurance -- two areas of law and tax planning typically shrouded in mystery -- have come to the forefront of the news cycle.  Unfortunately, both areas are typically poorly reported on not because of journalistic negligence or incompetence but due to the sheer complexity of the topics at hand.  Tax law is typically only taught in detail at the graduate legal level and captive insurance is not taught at all.  Moreover, the legal issues involved with captive insurance span a very broad swath of law including contracts, business entities, estate planning, tax planning, and insurance – three of which (estate planning, tax law and insurance) are in and of themselves legal specialties.   

     Recently, superintendent of the New York State Department of Financial Services began an investigation into the use by large insurance companies of captive insurance companies.  The purpose of this article is to provide the reader with a basic explanation and outline of captive insurance – what it is, how it came about and the current state of the law.  In addition, at the end I’ll talk a bit about the recent New York regulatory situation.  I’d be remiss at this point if I didn’t engage in a bit of self-promotion by stating that if you’d like to learn more you can purchase my book U.S. Captive Insurance Law or visit my firm's website.  At minimum, it will cure you of your insomnia.

            A captive insurance company is an insurance company owned by the insured.  The case law defines a captive as a “wholly-owned insurance subsidiary.”  While it may seem like insurance is always available, it can actually be harder to get than you’d think.  For example, if you own property in an area prone to being hit by hurricanes you’ve probably discovered that insurance coverage is very expensive.  Here are two additional real-world examples: due to the large amount of tort litigation in the 1970s, product liability coverage was impossible to get and in the mid-1980s, Congress amended the risk retention act allowing doctors to form risk retention groups because medical malpractice coverage had become extremely expensive.  Both of these industries are obviously important to the US economy, but their inability to procure insurance threatened their economic viability.  

            Even though companies started using captives for legitimate business reasons, the IRS had their doubts about this concept due to a very important technical legal reason: they were concerned that for tax purposes the captive was a “reserve.”  The key difference between a reserve and an insurance company is payments to a reserve are not deductible while insurance premiums are.  This key tax issue obviously meant there was a great deal of money riding on the legal outcome of captive litigation, which can be chronologically divided into four: periods: the reserve cases from the early 20th century, the early captive cases in the 1950s, the initial IRS victories from the late 1970s to the Humana case in 1987 and the IRS losses from Humana to the UPS case in the early 2002.  By the time of the UPS case, the writing was essentially on the wall that courts would accept certain types of captive structures.  At this point the IRS issued two Revenue Rulings which are essentially statements from the Treasury Department outlining how they will treat commonly occurring transactions.  In these rulings the IRS provided two legal safe harbors for captive insurance, essentially stating, “if you’re going to do this, here’s how you should do it.”

            While captives are typically associated with offshore tax planning, they are now an “onshore” phenomena: over 30 states have a captive insurance statute allowing for the formation of a captive in their jurisdiction.  While Colorado passed a statute in the early 1970s, Vermont’s statute passed in the late 1970s has become the de facto US model code or industry standard.  Some of the bigger captive jurisdictions are Vermont, Delaware and Utah.    

            So, let’s sum up so far.  Captives started in the 1950s because of deficiencies in the insurance market.  While the IRS challenged these structures for legitimate legal reasons, they were arguing against a historical tide.  Now, when properly structured and run, a captive insurance company is a valuable risk management tool used by over 5,000 US companies.

            Now let’s turn to the more recent events to see what’s going on.  The following excerpt is from Bloomberg:

Carriers in New York had $48 billion in “shadow insurance,” according to the report from Benjamin Lawsky, superintendent of the New York State Department of Financial Services. Lawsky has been investigating since July transactions that life insurers conduct with subsidiaries, known as captives.

Insurers use the captives to decrease the amount of capital they’re required to hold, Lawsky said in the report. The department said 17 New York-based firms use such transactions, without identifying them. The captives, which are typically based in other jurisdictions, are sometimes capitalized with letters of credit or intra-company guarantees, which can leave the parent responsible for claims if losses mount.

In essence, this is a question about capital and capital requirements.  According to the Third Edition of Barron’s Dictionary of Finance, capital is the “difference between the company’s asset and liabilities.”  This value protects the interests of the company’s policy holders in the event it develops financial problems.”  Ideally, capital should be in cash or a cash equivalent for fast access in the event it’s needed.  But while all US states allow a captive to use a letter of credit for capital, the real issue is the reserves backing the LOCs.  Under Basil II, the US requirement is 10% while for an offshore bank it’s between 1%-3%.  It is the difference in the reserve requirements among issuing institutions that has New York concerned.  And if a captive is backed by a personal or corporate guarantee you’ve potentially got bigger problems.

            So let’s play this out in a catastrophic situation.  Large US insurer has shifted some liabilities to a “web” of offshore captives.  While these captives are capitalized with letters of credit, the capital backing those letters is less stringent.  As a result, in the event a wave of liabilities hits the company, the possibility of capital being depleted increases.  This is the nightmare scenario concerning the New York authorities.

The issue here is not the use of a captive insurance company; it’s the capitalization of the captive that is concerning the regulators.  Captives are now an accepted and often used risk management tool.  However, this case does highlight the need (as with any financial tool) to use them correctly.  And it also shows that once again, New York state and its various institutions appears to be the real regulator of US markets while the FRB and SEC sit on the sidelines.


Gold Consolidating At Low Levels


The overall chart for gold is still extremely bearish.  Prices are below all the EMAs and are using the shorter EMAs for technical support.  Although rising, the MACD is still negative, as is the CMF.

But most importantly, prices are consolidating in a triangle consolidation pattern -- a pattern that has been forming for for the last month or so.

Thursday, June 13, 2013

Slow Export Growth and Weakening Manufacturing

First, consider this graph of the monthly export totals from the US:


After dropping sharply during the recession, exports came roaring back.  However, their overall rise has really stalled first around the $130 million/month area.  Also note that in the latter half of 2012 the overall increase was weaker than before.  This time corresponds to the weakness in the EU.


On the ISM manufacturing index, note that we see a drop in early 2011.  There is a slight downtrend from that time to now, with the numbers now fluctuating around the 50 level.


Retail sales a welcome positive surprise; good initial claims too


- by New Deal democrat

May retail sales posted a very unexpected +0.6% increase over April. Since CPI probably increased about +0.2% in May, this means that real retail sales increased ~+0.4%. The dark cloud in that silver lining is that presumably the savings rate fell to a new post-recession low, but we won't find that out for another couple of weeks.

Meanwhile initial claims decreased to 334,000. Once again this is within the range of a normal expansionary reading. Since the recent weekly high of 363,000 initial claims passed out of the 4 week average, that now declined to 345,250. This is still about 10,000 above what I would want to see in a normal expansionary environment.

While growth has still been not nearly good enough, it remains surprising just how resilient the economy has been.

Employer Behavior is Still Weak

The following includes the latest JOLTs survey:


The red line shows total employer hires.  There are few important points about this data.  First, it really hasn't increased that much over the duration of this recovery.  It fell to 3.6 million at the very end of the recession while rising to 4.4 million in the latest report.  Also note the level has been stagnant for a little over a year -- not a good development.  An most importantly, the current level is the lowest level seen in the last expansion which was itself called a jobless recovery. 

The good news on the chart is that openings continue to increase.  But the current level is still at low levels relative to the previous expansions.

Short version: employers are just not in a hiring mood right now.

Wednesday, June 12, 2013

Little Upward Pressure on Oil Prices

From Bloomberg:

The International Energy Agency trimmed demand forecasts for OPEC’s crude in the second half of the year amid signs of slowing growth in China as output from the producer group rose to a seven-month high. 

The Organization of Petroleum Exporting Countries will need to provide an average 29.8 million barrels a day in the second half, the IEA said today in its monthly market report, lowering its assessment from the previous report by 200,000. That would require OPEC to cut output by 1.1 million barrels from the 30.9 million it pumped in May, according to the report. The agency kept its global oil demand estimates for this year unchanged. 

“While Europe’s economic woes are taking a toll on demand, there are mounting signs that China’s oil use, like its economy, may have shifted to a lower gear,” the Paris-based adviser to 28 oil-consuming nations said. 


On the oil chart, notice that the 96-98 prices level is still providing resistance.

Copper ETF Breaks Key Support


The JJC chart has two key levels right now. The first is is in the lower 43 area -- the price level established early last November.  Prices tried to advance through this level three times in May and June, only to fall back.  The second important price level is the 40-40.5 area which was prividing support for prices.  Prices moved through this level at the beginning of the week.  Also note the continued underlying weakness of the technicals: The MACD stalled at 0 and has had a neutral reading for the last month; prices are below all the EMAs, including the key 200 day EMA.  


Market/Economic Analysis: UK

The UK has one fundamental problem: incredibly weak GDP growth.  Here are two relevant charts:


The top chart shows the overall level of GDP which shows the UK economy's overall level of GDP is still below its pre-recession peak.  The second chart shows the reason for this slow growth: they're had five quarters of Q/Q GDP contraction.

The main culprit has been a continued decline in manufacturing and, as a result, investment:


The top chart shows manufacturing has contracted in 6 of the last 7 quarters while the top chart shows a continual decline in manufacturing.


As a result of manufacturing's decline, there is no need to make capital investments.  Hence we see that gross fixed capital formation has declined in 5 of the last 8 quarters.

However, there are signs that overall activity may be picking up.  The following is from the Bank of England's latest policy minutes:

13 The preliminary release of Q1 GDP had shown a 0.3% increase, all of which had been accounted for by the services sector. In line with the usual pre-release arrangements, the Governor informed the Committee that industrial production had risen by 0.7% in March, on the back of a 1.1% increase in manufacturing output. The level of production in February had been revised down, however.
Nonetheless, the pattern of growth over Q1, together with the increase in the April CIPS/Markit indices, suggested that the level of overall activity at the beginning of the second quarter was likely to have been higher than the Committee had previously anticipated, and Bank staff’s projection for the
preliminary estimate of Q2 growth was 0.5%, although there was a sizable margin of error around such a forecast. Looking further forward in 2013, there was the possibility of a stabilisation in oil production in the North Sea and in the output of the construction sector.


14 Recent indicators of expenditure had been broadly positive. Retail sales had risen on the quarter and, accounting for seasonal factors, there had been a 16% increase in new private car registrations in the three months to April compared with the previous three months. Broad money holdings of the corporate sector had increased by around 10% at an annual rate in Q1, perhaps as a prelude to greater business investment. And, in line with the usual pre-release arrangements, the Governor informed the Committee that both imports and exports of goods had risen strongly in March.


As the GDP chart above shows, consumer spending hasn't been a problem.  It's been positive for the last 6 quarters.  Manufacturing has been the economic stick in the mud.  But that might be changing.  First, is the news from the Markit survey

The UK manufacturing sector continued its positive start to the second quarter of 2013. After returning to growth in April, May saw operating conditions improve at the fastest pace in over a year, with growth of production and new orders both accelerating. The domestic market was the main driver of new order inflows, although new export business also contributed with a modest increase.
 

At 51.3 in May, up from a revised 50.2 in April, the seasonally adjusted Markit/CIPS Purchasing Manager’s Index® (PMI®) posted its highest reading since March 2012 and remained above the neutral 50.0 mark for the second straight month.
 

The expansion of manufacturing output was broad-based in May, with growth registered by the consumer, intermediate and investment goods sectors. The strongest performance was seen at consumer goods producers. UK manufacturers generally linked higher output to improved new order inflows, successful new product launches and efforts to clear backlogs of work.

Here are the charts from the report:


The top chart shows that the overall Markit number has again moved into positive territory.  However, it is the lower chart that shows all three manufacturing sectors -- consumer goods, investment goods and intermediate goods -- are again printing in positive territory.

This is corroborated by the latest UK manufacturing report.  Although the latest numbers show a .2% drop, this followed two months of increases:

Despite the April fall, the figure is stronger than it was at the start of the year and provides an early indication that manufacturing output, which makes up just over 10 per cent of the economy, will lift GDP in the second quarter.
“The fall in manufacturing output does follow large rises in February and March and the underlying position is probably one consistent with some small forward momentum,” said David Tinsley, UK economist at BNP Paribas, a bank.

Let's turn to the UK charts.


Overall, the UK ETF is still in an uptrend.  There are two trend lines supporting the current rally.  Prices are approaching both.  While momentum is dropping, the risking CMF is positive. 

It's still way too early to get excited about he UK.  We've only got a few months of data compared to a horrendous track record over the last three years.  Also remember this is an economy that is providing a great example of why austerity is a bad idea. 

Tuesday, June 11, 2013

Gas prices probably caused Americans to lose ground in May


. - by New Deal democrat

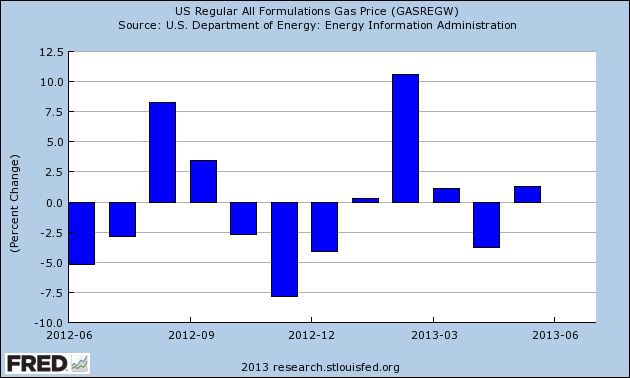
We now have final gas price information for May. While prices increased dramatically from the beginning of the month, the average price for May was only about 1% higher than the average price for April:


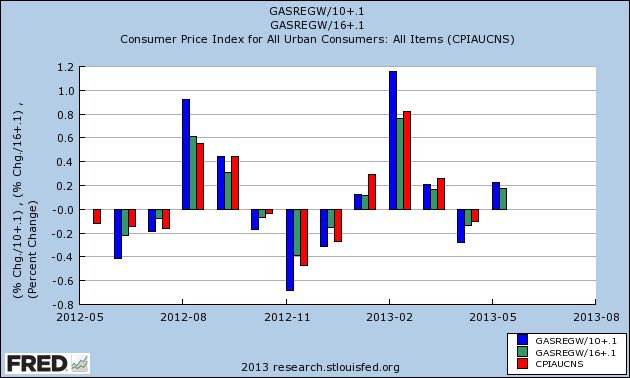
In order to get the range of likely outcomes for inflation as a whole for the month, we can divide by 10 (blue) or 16 (green) and then add 0.1%. Here's a graph showing that outcome for the last 12 months (CPI in red):


The above CPI reading is not seasonally adjusted, but in May the adjustment is minimal, so seasonally adjusted consumer price changes are probably the same. In other words, CPI is likely to rise +0,2% +/-0.1% for May.

We know that average wages rose less than 0.1% in May, and retail sales are predicted to rise only 0.1% as well. In short, gas prices caused average Americans to fall behind last month.

Is the Monthly Economic Number Really Bullshit?

On Friday, I wrote the following about the monthly BLS data release:

OK -- I disagree with the birth/death model argument, but that's beside the point.  The monthly NFP data point -- and all of the hoopla that surrounds it in various forms -- is pure bullshit.

First, this was a bit of an over-reaction on my part.  What I meant to say was the hoopla associated with this statistics release is bullshit.  Every month, starting on about Wednesday, everything stops in anticipation of the report.  The excitement and tension builds with the financial world literally stopping by Friday morning.  Then, a ton of people (primarily political flunkies) who have no business analyzing the report do so, issuing proclamations from on high.  By Monday we all settle down forgetting the madness that is the monthly NFP release until the next round in 30 days. 

Just as importantly is the NFP report is subject to several revisions, meaning the number that has the most impact -- the headline number in the initial release -- could be revised to the point of being non-recognizable to the people who first heard it.  Now -- all economic numbers have this problem.   But very few economic numbers inspire the level of focus as the monthly NFP data.

Let's stipulate the following point: the jobs market is one of the most important economic indicators out there, if not the most important.  An economy that is primarily based on consumer spending cannot move forward without a healthly jobs market.  But, as the Atlanta Fed has correctly pointed out, the jobs market is composed of several different, measurable components.
  • Employer behavior: not what they're saying, but what they're doing relative to the jobs market.  Are they advertising open positions?  Are they actually hiring once those positions have been advertised?
  • Confidence: do businesses have enough confidence in the future to increase their hiring plans?  Are people confident enough in the jobs market to quit a job (with the most likely reason being that jobs are easy to get)?  More broadly, what opinion of the jobs market is held by both business and potential employees?  
  • Utilization: of all the people in the work force,is the economy effectively and efficiently using their talents?  Are people "just getting by" or are they really contributing to the overall development of the economy?
  • Leading indicators: where are we in the business cycle?  What is the likely direction of the jobs market in the next 3, 6, and 9 months? 
The point is there are a myriad number of components to a well-functioning jobs market.  A healthy market inspires confidence so that employers are willing to increase their hiring plans.  A longer period of confidence (multiple years, ideally) would lead to more efficient utilization of the labor force.  These developments could by objectively observed in employer behavior and the leading indicators.

The point of this is the monthly NFP ritual completely masks the complexity of the jobs market.  And that's something I'm finding more and more aggravating.  


South American ETFs Are Selling Off

Consider the following weekly price charts:


The Chilean ETF has an uptrend connecting the mid-2012 and end of 2012 lows.  Prices broke that trend a few weeks ago and are now below the 200 week EMA.  Additionally, they are sitting at price support established in mid-2012.  Momentum and volume readings confirm the break-down.


The Mexican ETF actually broke trend earlier this year, but consolidated sideways between the 70 and 76 price level.  Prices have bee moving lower for the last few weeks, breaking price support established earlier this year.  Momentum is dropping and volume is flowing out of the market.


The Columbian ETF broke its uptrend earlier this year.   Over the last few weeks we've seen some volume spikes as the selling has accelerated.  Momentum is dropping and money is flowing out of the market.


Peru's ETF had a solid uptrend that lasted over a year and a half.  But prices moved lower about 6-7 weeks ago, printing strong bars lower.  Also note that momentum is declining and the CMF is negative.


Brazil has been trading at low levels for the last year because of a slowing economy.  However, prices have dropping sharply over the last few weeks, bringing momentum down and leading to a slightly negative CMF reading.


Monday, June 10, 2013

The Japanese Sell-Off In Perspective


Since Abe's election in November, the Japanese ETF has rallied strongly, rising from a low of 8.75 to ~12.50, for a net gain of about 43%.  Prices dropped through support at the beginning of June on very strong volume, indicating that traders were concerned about the strength of the rally relative to the underlying economic fundamentals (essentially asking have we risen too far too fast).  Prices fell to the 200 day EMAn which is also near the 50% Fib level.


The weekly charts shows that prices have found support around the 61.8% Fib level for the mid-2012/mid-2013 price levels.

My guess is we'll continue to see a thinning out of the rally trade as people take more of a wait and see attitude about Abe's policies.  However, news like this certainly won't hurt:

Japan has revised up its first-quarter economic growth to 1 per cent, giving Prime Minister Shinzo Abe a boost as he seeks to strengthen his grip on power in next month’s upper house elections.
Government data released on Monday showed that the economy expanded at an annualised rate of 4.1 per cent between January and March, lifted by strong household spending and a pick-up in private residential investment. That was much higher than the preliminary estimate of 3.5 per cent, which was already the fastest rate recorded by any Group of Seven economy.