- by New Deal democrat
As you probably already know, real GDP increased 1.1% at a seasonally adjusted annualized rate in Q1. This doesn’t necessarily mean that the economy improved throughout the period. The median GDP for the quarter where post WW2 recessions have begun was +2.4%, and there are reasons to believe that the reason for the positive number in Q1 was big January gains. We’ll find out tomorrow with personal income and spending, and real business sales, whether these were reversed in the following two months.
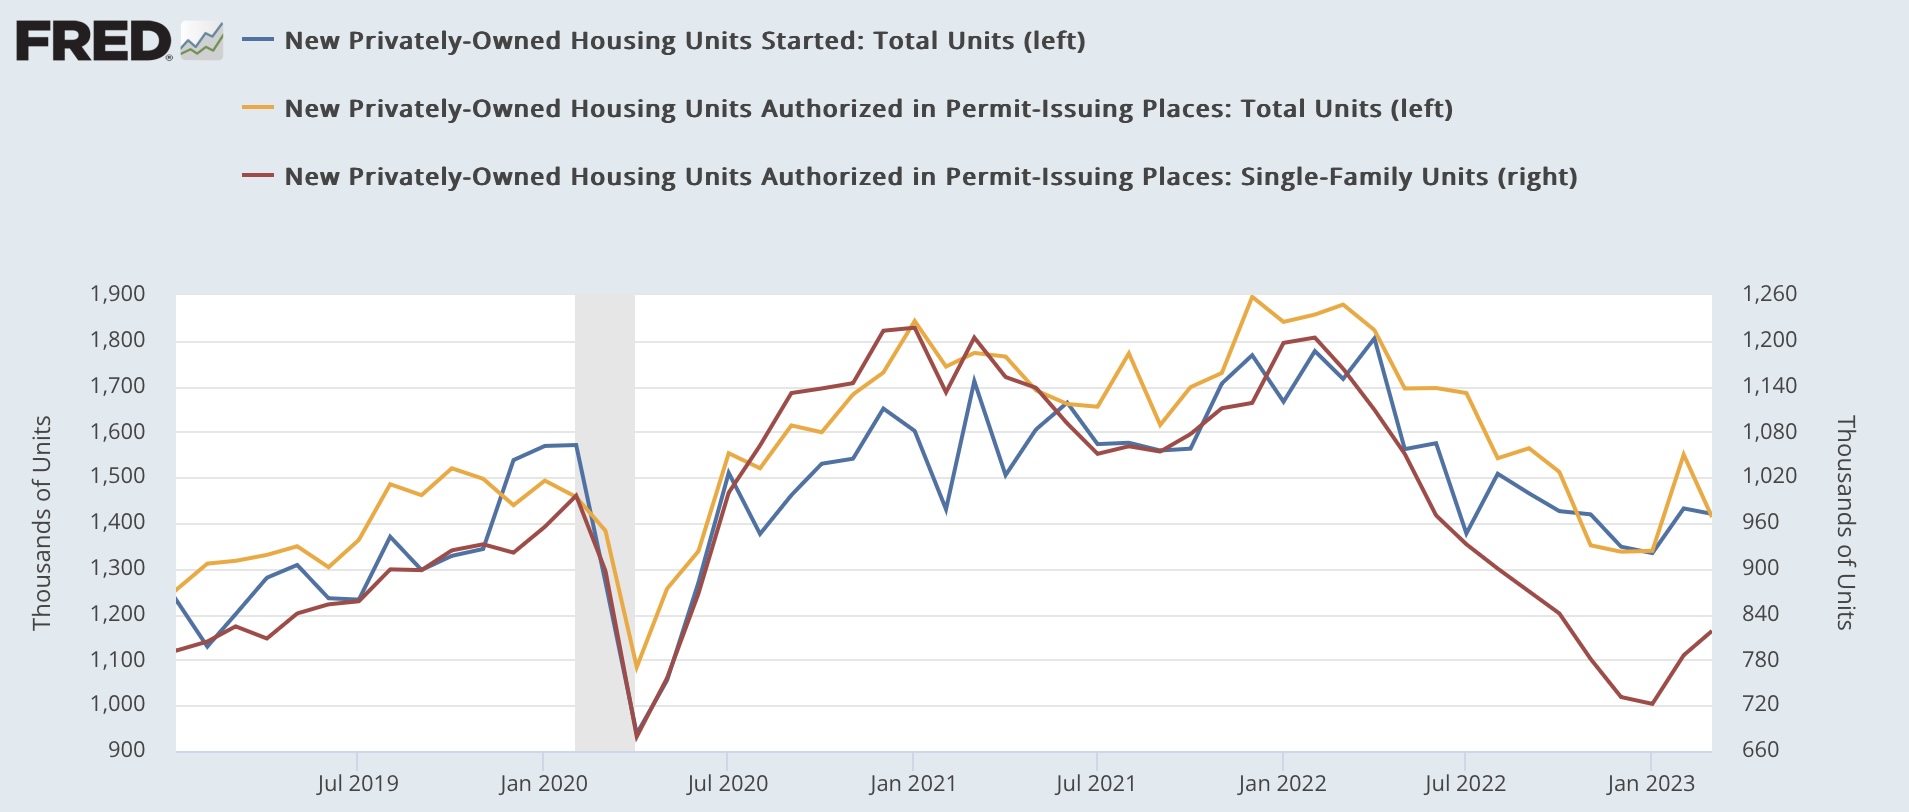
While GDP by and large is a look in the rear view mirror, there are two leading components. First, private residential investment as a share of GDP is a long leading indicator popularized over 15 years ago by Prof. Edward Leamer. It tends to turn down 6-7 quarters before a recession hits. It is even slightly more leading when calculated in real inflation-adjusted terms. Unsurprisingly, in Q1 of this year this declined again, although less so than in the last several quarters, whether measured nominally or in real terms:

Secondly, proprietors’ income (light and dark blue in the graph below), a proxy for corporate profits (light and dark red), which won’t be reported for another month, were up +0.2% nominally, and +3.9% without inventory valuation:

But the “official” leading metric uses unit labor costs as a deflator, which we also don’t know yet, so I’ve substituted the implicit GDP deflator as a temporary fix:

So adjusted, proprietors’ income declined -0.7% for the quarter with the inventory adjustment, but increased 3.2% without it.
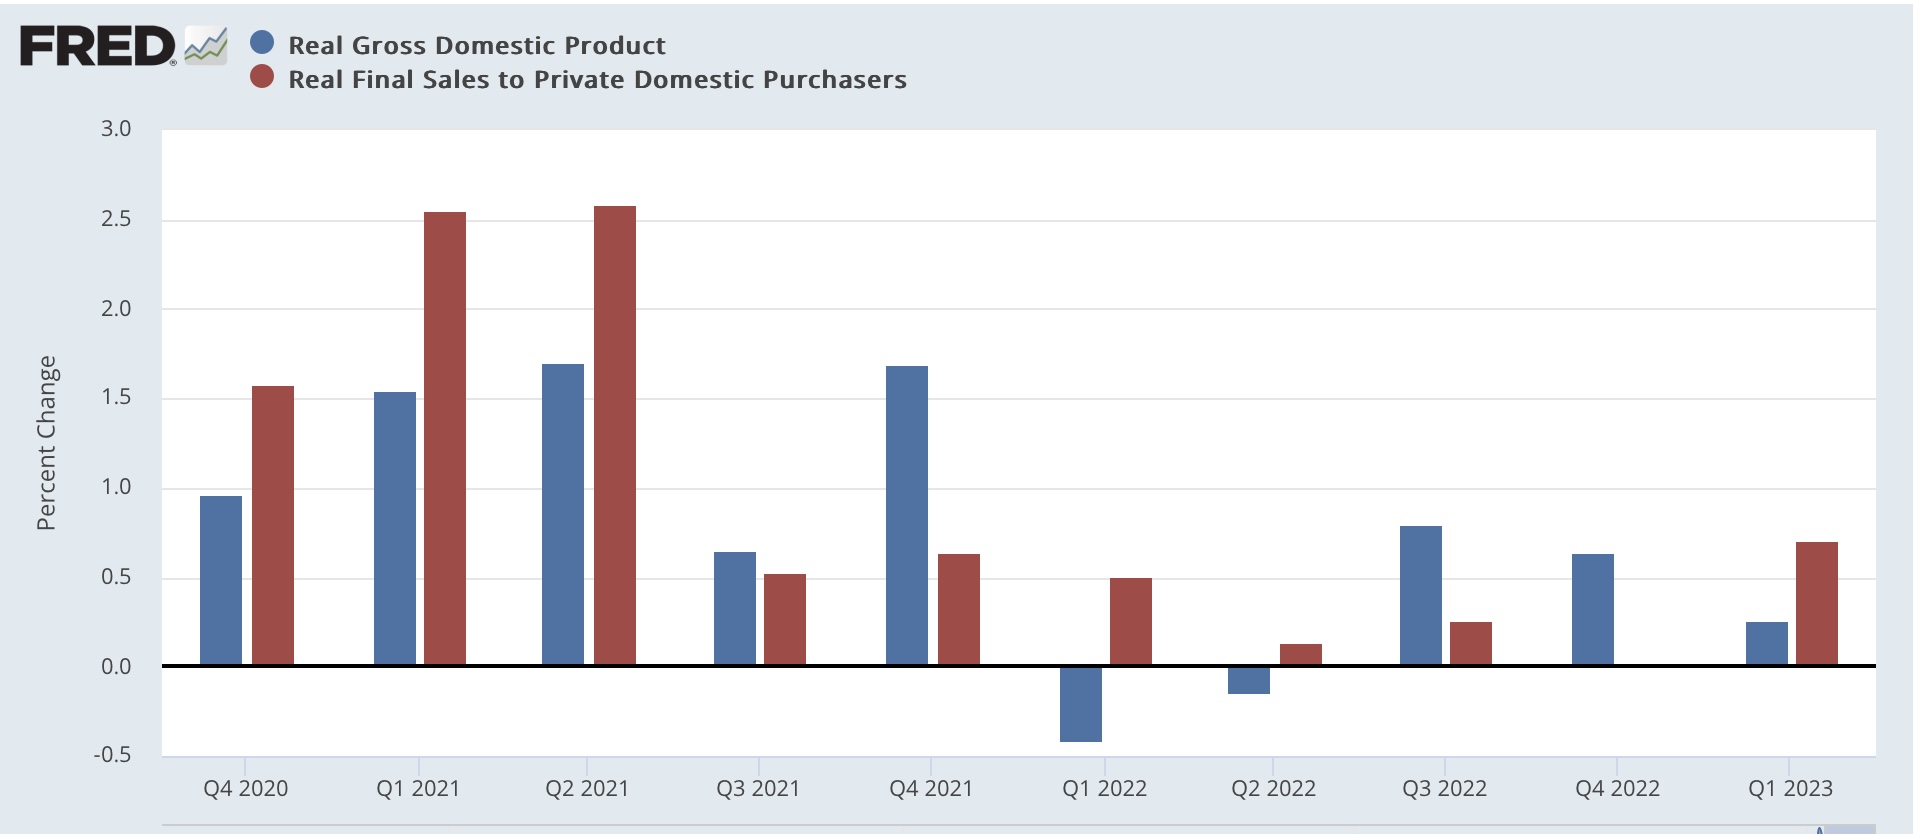
Finally, last month I noted that real final sales at levels as low as it had been in Q4 were typically seen within 3 quarters of the onset of a recession. These did improve in Q1, but don’t undo the negative inference going forward:
Overall, this is a mixed picture, but still tending to the negative in terms of implications for the near future.