- by New Deal democrat
On Wednesday I discussed how gas prices, with an assist from higher stock prices leading to stock options being cashed in, was the primary reason why the coincident indicators hadn’t rolled over yet.
I wanted to explore that a little more: was the boost from lower gas prices going to allow for a “soft landing,” or a “modified limited rolling recession,” if you will? Or was the boost ending, where we could expect the other factors driving the economy to take precedence? Let me look at this two ways.
First, gas at the pump has to be funded by wages. So one way to measure the impact of gas prices on consumers is to compare the two. In order to take the effects of Russia’s invasion of Ukraine out of the picture, in the below graph I have normed both gas prices and non-managerial wages to 100 as of April 2 years ago. Here is the long-term graph:
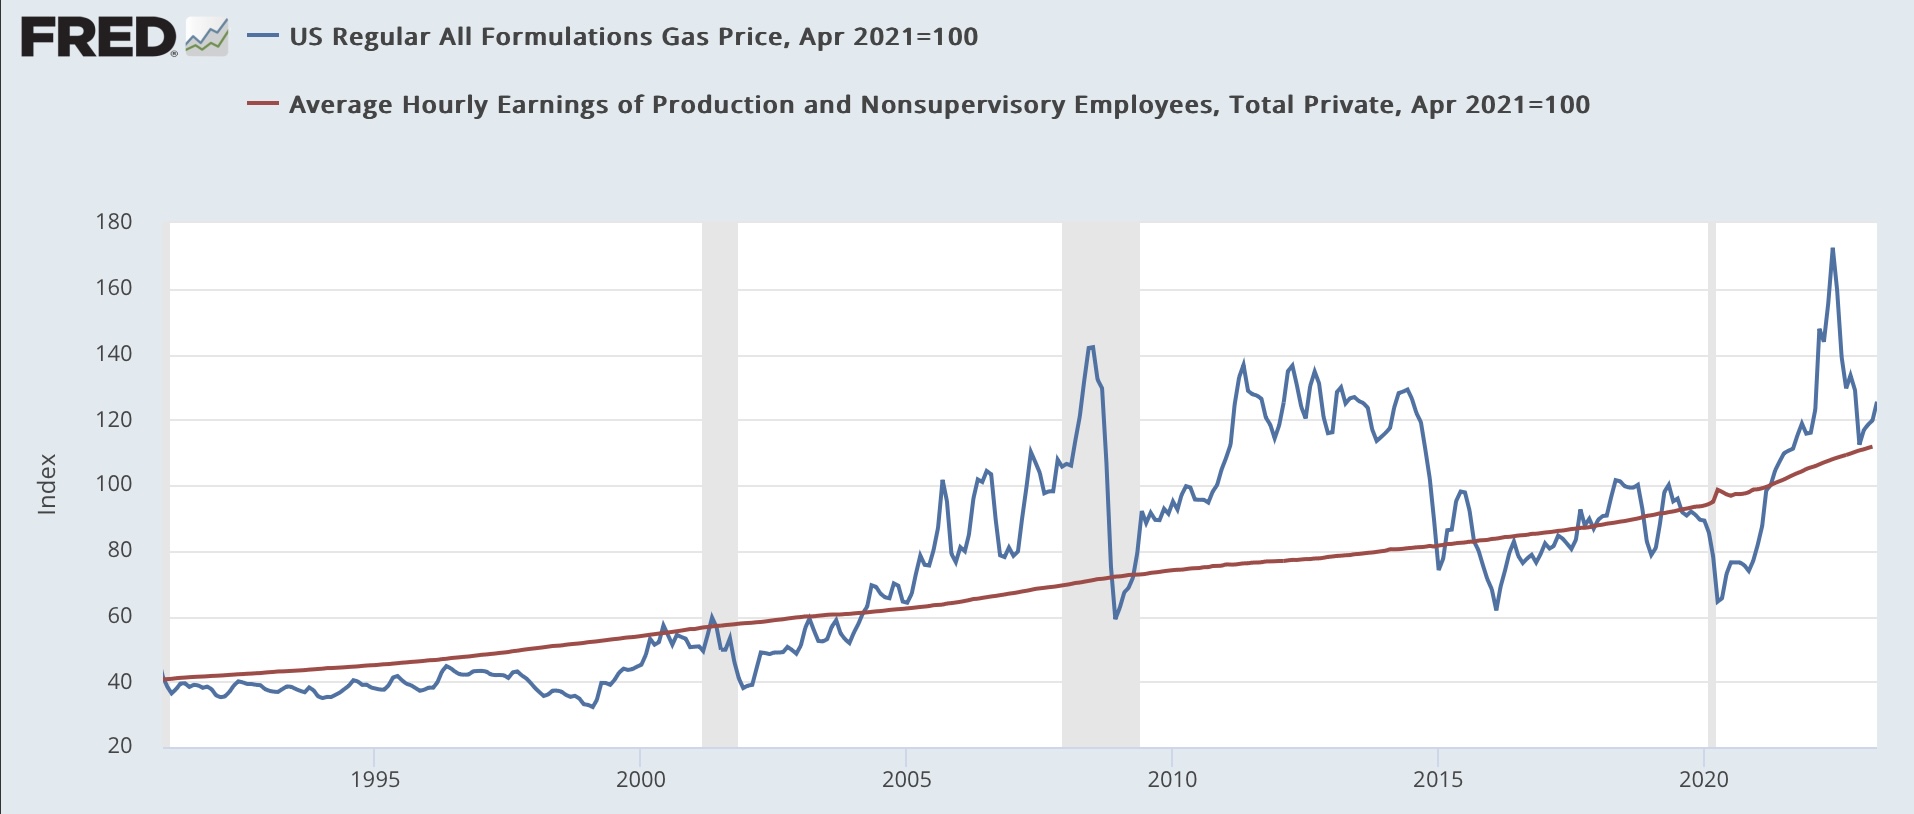
We can see the periods of really cheap gas prices at the end of the 1990s, and during both recent recessions, as well as the big downturn in 2014-15. More recently, we can see that the run-down in prices in the second half of last year took us about to the historical norm. Since the beginning of this year, prices have turned “relatively” expensive, without engaging an actual “choke collar” on the economy, as they did in the first part of last year.
Here’s another look at the same data, this time dividing gas prices by hourly wages:

The stress caused by the Russian invasion of Ukraine is over, but the tailwind of the downturn in prices thereafter has ended as well.
Second, it’s been suggested that whenever gas prices hit a certain level of GDP, that has been enough to trigger a recession. I show that below by dividing gas prices by nominal GDP, and norming the data to 100 as of Q4 2007, the last time an oil price spike helped spark a recession:

Note at the far left how the impact of the invasion of Kuwait by Iraq in 1990 helped trigger that recession as well.
Last year’s run-up didn’t quite hit the 100 threshold, peaking at 90. This was enough to crimp GDP without actually causing a recession. By the end of Q4 that had entirely receded. We’ll find out about Q1 next week.
Let’s look at this same data on a YoY basis. Below I show the YoY% change, inverted, of gas prices averaged quarterly (so that a decrease in price shows as an increase, e.g.), together with YoY nominal GDP (*5 for scale):

Basically this shows that “the remedy for high (low) prices is high (low) prices.” Big run-ups in prices create GDP slowdowns about 1 year later, and big run-downs in prices an increase in YoY GDP a year later (but of course it’s not monocausal, e.g., the tech boom of the late 1990s and the shallow industrial recession of 2015-16 were not particularly in tune with gas prices).
This graph suggests that the effects of the big run-up in gas prices early last year have not yet fully been felt, and that the effects of the run-down in prices thereafter will probably show up by next year.
The bottom line for now is that gas prices probably were part of the GDP slowdown in the first 2 Quarters of last year, and probably a part of the rebound thereafter, up into Q1 of this year. But the tailwind is probably over beginning this Quarter. In other words, I expect the effects of other aspects of the economy to increase in salience beginning with this Quarter’s data.