- by New Deal democrat
M1 and M2 money supply for May was reported yesterday by the Fed. The former was unchanged for the month, and the latter was up a tiny 0.1%:
- by New Deal democrat
M1 and M2 money supply for May was reported yesterday by the Fed. The former was unchanged for the month, and the latter was up a tiny 0.1%:
- by New Deal democrat
House prices increases continued to go through the roof as of April, as reported this morning in both the Case Shiller and FHFA house price indexes. The Case Shiller national index rose another 2.1% for the month and 20.4% YoY, just 0.1% below last month’s biggest YoY% gain ever, while the FHFA purchase only index rose 1.6% for the month, and 18.8% YoY, below its peaks of 19.3% in February, and 19.4% last July. The YoY% changes for both for the past 5 years are shown below:
- by New Deal democrat
No big economic news today, and as usual little State reporting on COVID over the weekend, so let me make a couple of points.
- by New Deal democrat
My Weekly Indicators post is up at Seeking Alpha.
The weakness in the long leading indicators is increasingly spreading to the short leading indicators. The more this happens, the more inevitable a recession is, and the sooner it gets here.
As usual, clicking over and reading should be educating for you, and rewards me just a little bit for my efforts.
- by New Deal democrat
In response to April’s dismal report, I wrote that “new home sales are heavily revised after the first report. It is not unusual at all for big monthly moves like this to suddenly look much less severe when the number gets revised one month later. I would not be surprised in the slightest if that happened to this month’s cliff dive, when next month’s report comes out.”
- by New Deal democrat
Initial jobless claims declined -2,000 to 229,000 last week, vs. the 50+ year low of 166,000 set in March. The 4 week average rose 4,500 to 223,500, compared with the all-time low of 170,500 eleven weeks ago. Continuing claims rose 5,000 to 1,315,000, which is 9,000 above their 50 year low of 3 weeks ago:
Initial claims have been in an uptrend over the past 2.5 months. If this continues until the end of this month, they will no longer qualify as a “positive” in my array of short leading indicators, although they have not risen to levels that would change their rating to a negative.
Since the normal DOOOMers are baying that we are already in a recession, now is a good time to resurrect the construct that initial jobless claims lead the unemployment rate.
Why? Well, for example, the Sahm Rule is that when the 3 month moving average of the unemployment rate rises by 0.5% relative to its low in the previous 12 months, you’re in a recession. That’s somewhat conservative. On at least two occasions, 1953 and 1970, the unemployment rate only went up 0.1% for 1 month before a recession started. Paul Volcker started a recession in 1981 where the unemployment rate hadn’t moved up at all!
But in general, while the unemployment rate is a lagging indicator coming out of a recession, it is actually a negatively over-sensitive one, as it is a slightly *leading* one going into recession.
With that in mind, here is the long term graph of initial jobless claims (red) vs. the unemployment rate (blue, right scale):
Typically a uptrend in initial claims leads an uptrend in the unemployment rate by 2-4 months.
Here’s the past two years:
The very mild uptrend in initial claims we’ve had in the past several months is similar to the one at the beginning of 2021 during the first winter wave of the pandemic. That led to a pause in the decline of the unemployment rate a few months later during spring 2021.
At worst, the current uptrend in claims (so far!) is consistent with a potential 0.1% uptick in the unemployment rate going into autumn.
Which means, while it’s not impossible, it’s very unlikely that the unemployment rate will signal the onset of a recession during that time.
- by New Deal democrat
Although existing home sales are less economically important than new home sales, what has been happening with their prices, given the experience of the housing bubble and bust 15 years ago, is of added importance.
- by New Deal democrat
The COVID-19 pandemic is ever so gradually transforming into an endemic illness, the major risks of which still mainly fall on seniors.
- by New Deal democrat
My Weekly Indicators post is up at Seeking Alpha.
My paradigm is: first the long leading indicators turn. Then the short leading indicators turn. Then the coincident indicators turn. Finally the lagging indicators turn.
For months I have been documenting the downturn among the long leading indicators. In the past few weeks, that deterioration has been gradually spreading among the short leading indicators.
As usual, clicking over and reading will bring you up to the virtual moment as tho the state of the economy, and will bring me a small reward for my efforts as well.
- by New Deal democrat
The usual suspects are out, claiming that a recession has either already started or is imminent. Well, the big reason I call industrial production the King of Coincident Indicators is because empirically is the one whose peaks and troughs coincide most definitively with NBER recession dates. And unless there is a significant downward revision, in May the King of Coincident Indicators proclaimed: no recession yet.
Total production rose 0.2%, while manufacturing declined -0.1%. April’s overall number was also revised higher, from 1.1% to 1.4%, while manufacturing remained at +0.8%. The former made yet another new record high:
On a YoY basis, total production is up 5.8%, while manufacturing is up 4.9%. Compared with the last 40 years, and particularly the last 20, this remains pretty good growth:
A recession *could* start from these YoY numbers (see 1990 and 2007), but usually YoY production is decelerating pretty rapidly before a recession actually begins.
A close-up of the monthly changes since the depth of the pandemic recession shows that May was weak, like much other data for the month, but not indicative of any significant trend change yet:
- by New Deal democrat
Housing permits and starts declined across the board in May.
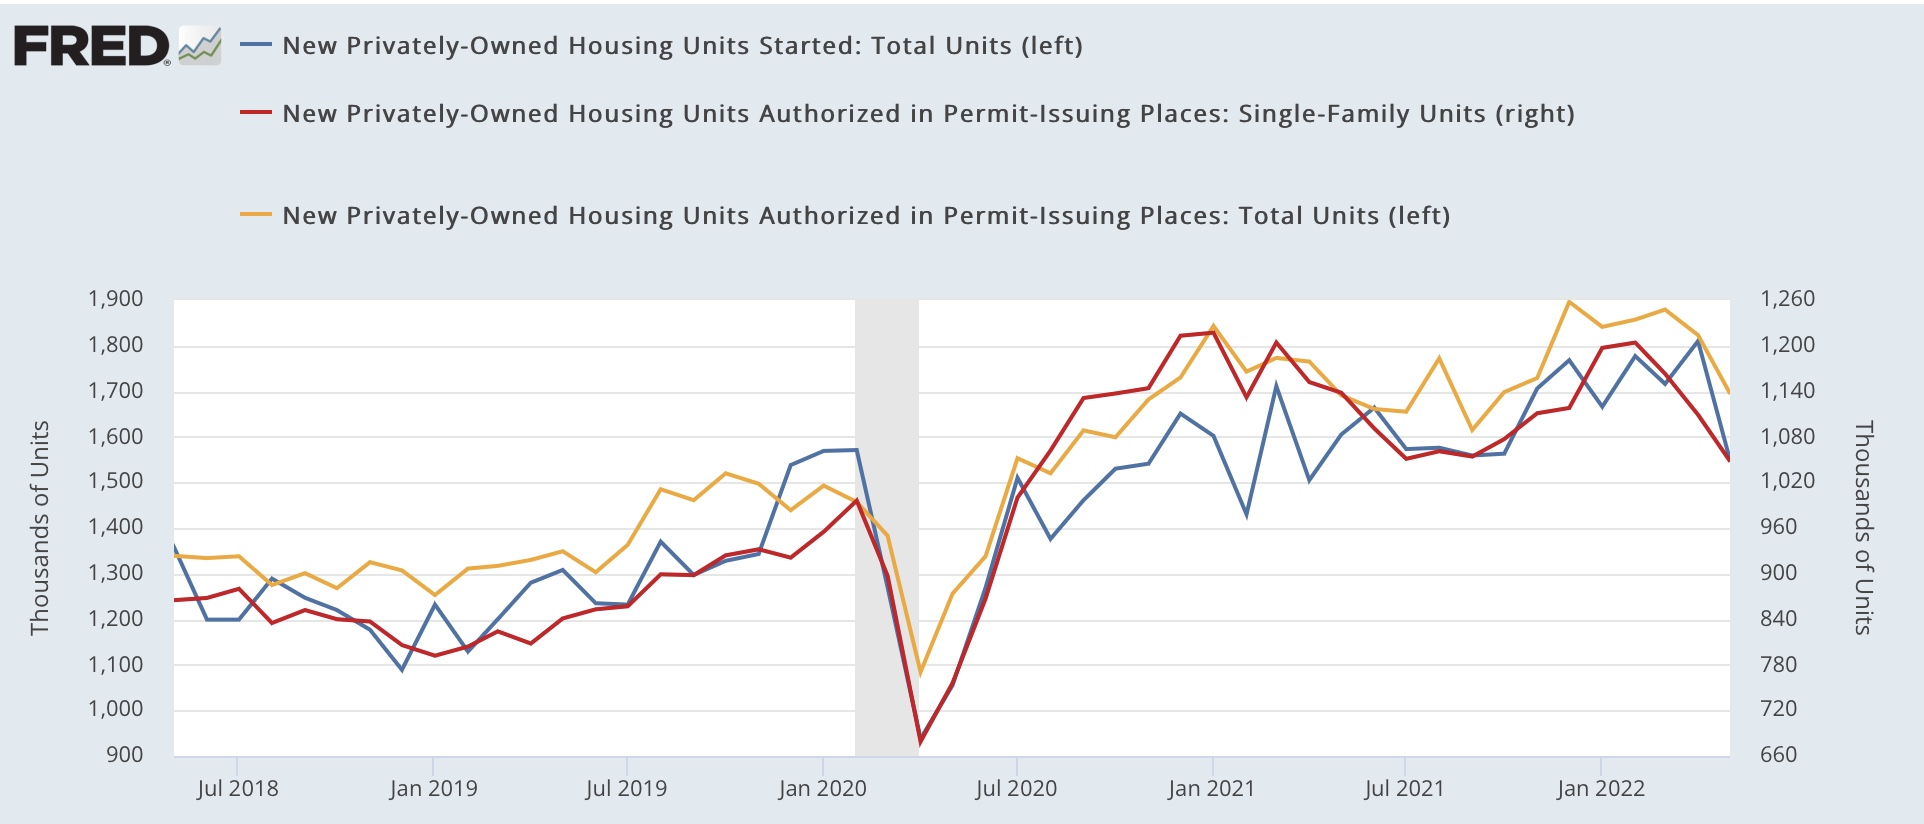
In the past year there has been a unique divergence between permits and starts due to construction supply shortages. This has been reflected in the number of housing units authorized but not started increasing to a near-50 year records of 298.4 in March. In May that number increased from April by 1.5 million annualized to 287.6:
For the month, single family permits (red above, right scale) declined 61,000 annualized to 1.048 million, a 22 month low. Total permits declined 128,000 to 1.695 million annualized, an 8 month low, and starts declined for the month by 261,000 to 1.549 annualized, a 13 month low.
Finally, below is the most recent version of a graph I have run many times in the past 10 years, showing that mortgage interest rates (red, inverted *10 for scale) lead housing permits (gold) and starts (blue):
Interest rates are higher by 2% vs. one year ago. As the graph shows, the last time the comparison was this bad was 1994, resulting in a 20% decrease in permits and starts the following year. Both permits and starts have now turned negative YoY.
The “demographic tailwind” that buoyed housing activity 5 and 10 years ago has dissipated, as the number of 25-35 year old first time buyers has stopped increasing. Thus I expect a 20% YoY decline in housing permits and starts to manifest over the coming 12 months.
The conundrum is whether the 50 year high backlog in units not yet started will delay the downturn until it clears - which might take another 6 to 12 months. Since starts are the actual economic activity, until I see an unequivocal downturn there, the massive negative signal from permits, mortgage rates, and mortgage applications remains open to question.
- by New Deal democrat
Initial jobless claims declined -3,000 to 229,000 last week, vs. the 50+ year low of 166,000 set in March. The 4 week average also rose 2,750 to 218,500, compared with the all-time low of 170,500 ten weeks ago. Continuing claims rose 3,000 to 1,312,000, or 6,000 above their 50 year low of 2 weeks ago:
It’s now clear that initial claims have been in an uptrend over the past 2.5 months. If this continues until the end of this month, they will no longer qualify as a “positive” in my array of short leading indicators, although they have not risen to levels that would change their rating to a negative.
This is yet more slight weakening in the economic indicators, and yet more reason for concern about a recession as we get to 2023.
- by New Deal democrat
Nominal retail sales for the month of May declined -0.3%, and April was revised down by -0.2% to +0.7%. This reduces April’s number, after inflation to +0.4%, followed by a “real” decline in May of -1.2% after rounding. YoY real retail sales were up 8.1%, but because inflation in the past 12 months has been 8.5%, real retail sales YoY is down -0.4%. Here is a graph of the absolute value of real retail sales:
- by New Deal democrat
I’m still on the road, and there is no important economic statistic to report, but I will make a brief market comment.
- by New Deal democrat
I’m still traveling, so light posting for a couple days more.