- by New Deal democrat
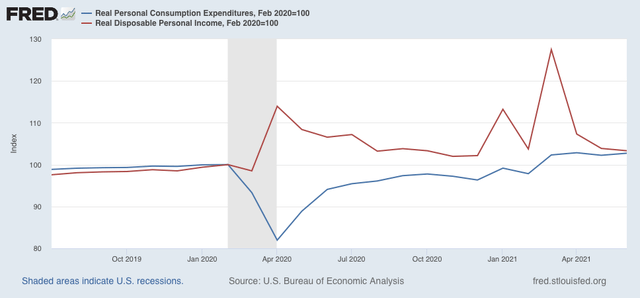
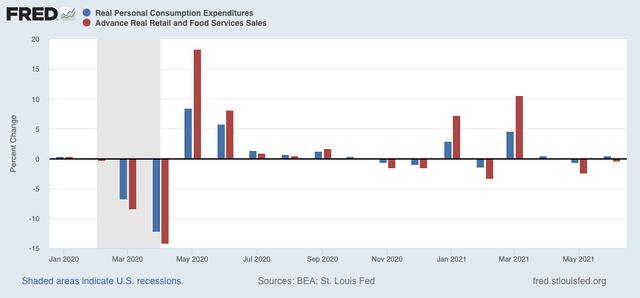
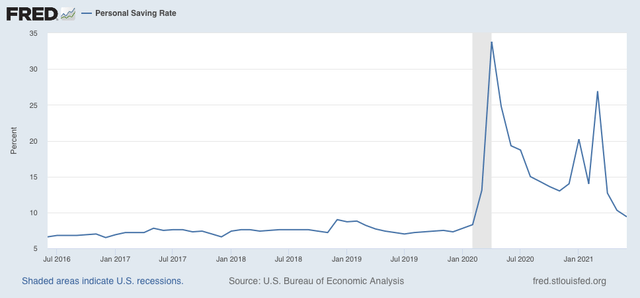
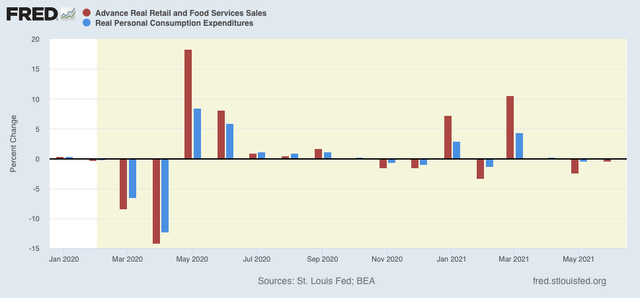
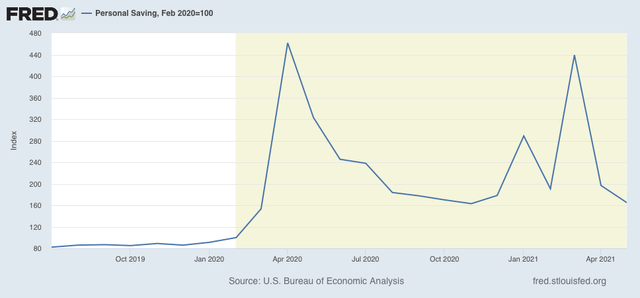
How well personal income and spending held up throughout the pandemic is one of the best things about the government response.


- by New Deal democrat
How well personal income and spending held up throughout the pandemic is one of the best things about the government response.


- by New Deal democrat
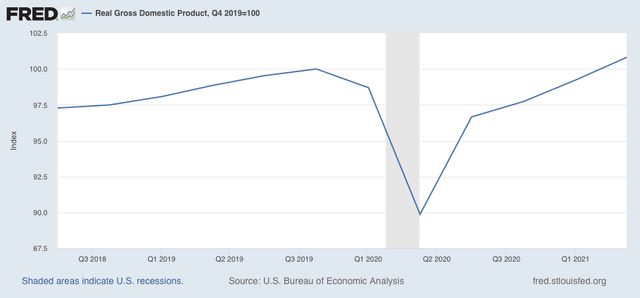
Nominal GDP before inflation increased 3.1%, while real GDP for the 2nd Quarter increased 1.6%. The real annual rate of growth was thus 6.5%. Real GDP is now 0.8% higher than its last quarter before the onset of the pandemic:

- by New Deal democrat
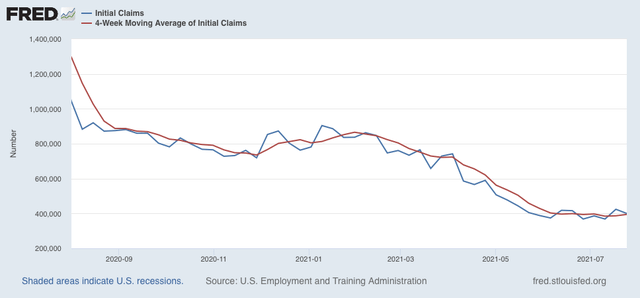
Initial jobless claims declined 24,000 this week, but at 400,000 this was the 2nd week in a row starting with a “4” handle. The 4 week average of claims also increased by 8,000 to 394,500:


- by New Deal democrat
Four weeks ago I wrote:


- by New Deal democrat
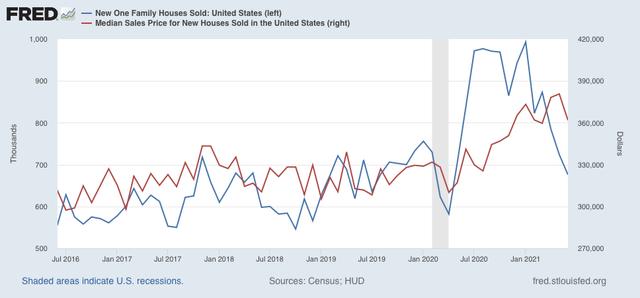
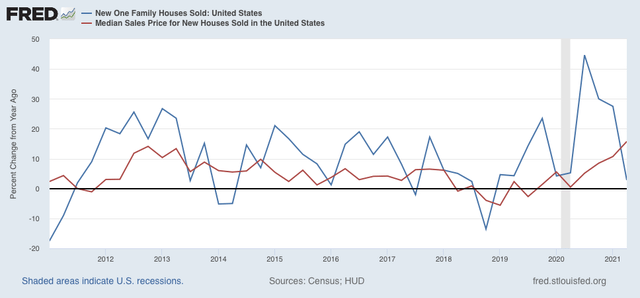
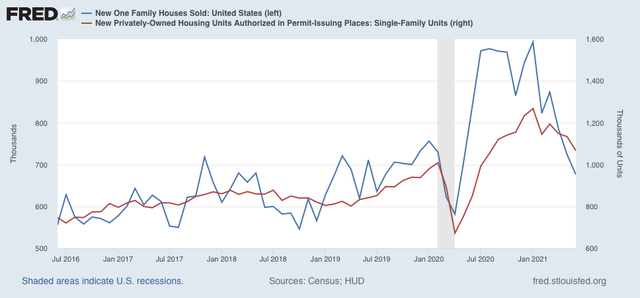
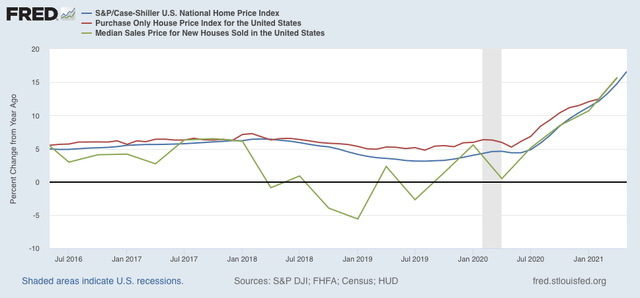
So I take a little one day road trip on my vacation, and come back to find much weeping and gnashing of teeth and generalized whining about a big decline in new home sales. Well, what exactly were they expecting?


- by New Deal democrat
My Weekly Indicators post is up at Seeking Alpha.
No visible impact on the economy yet due to the Delta wave. In March 2020, the first indicator to tip over was restaurant reservations. I would expect that to be the first item to suffer now as well.
As usual, clicking over and reading will not only bring you up to the virtual moment, but bring me a penny or two for my efforts.
- by New Deal democrat
Existing home sales were reported yesterday. Since, although they are about 90% of the market, they have much less effect on the economy than new home sales, I normally don’t pay that much attention.
- by New Deal democrat
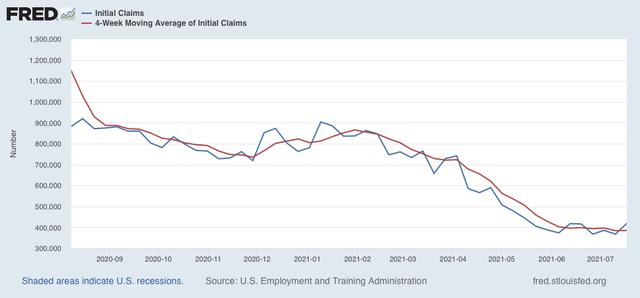
New jobless claims are the most important weekly economic datapoint with regard to the effects of vaccination progress. At this point, it is also a test of how much the “delta wave” of new cases is setting economic progress back. Three weeks I wrote that, because progress in vaccinations had largely stalled, “that implies at least a stall in the decline in new claims, and - I actually suspect - an increase, perhaps to about 450,000 per week or so.”
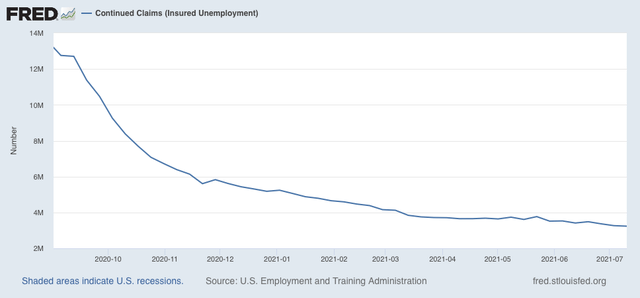
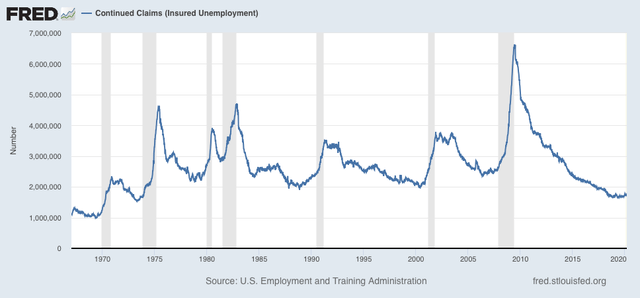
This week’s number may just be noise, or may be evidence such an increase. New jobless claims rose by 51,000 to 419,000, the highest number in 9 weeks. The 4 week average of claims also rose - slightly - by 750 to 385,2500. Here is the trend since last August:


- by New Deal democrat
I have been warning since late June that the situation would likely look very different by the end of July. By 2 weeks ago, I wrote:
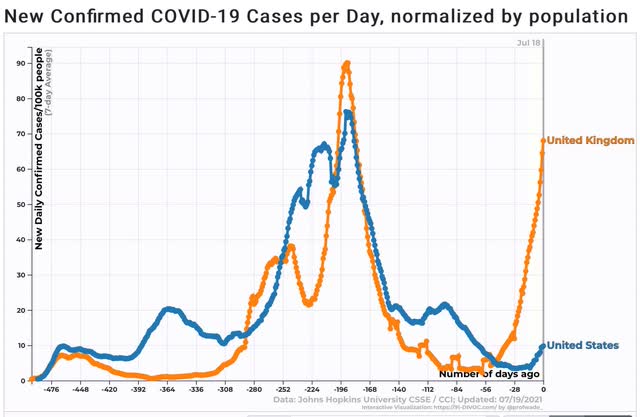
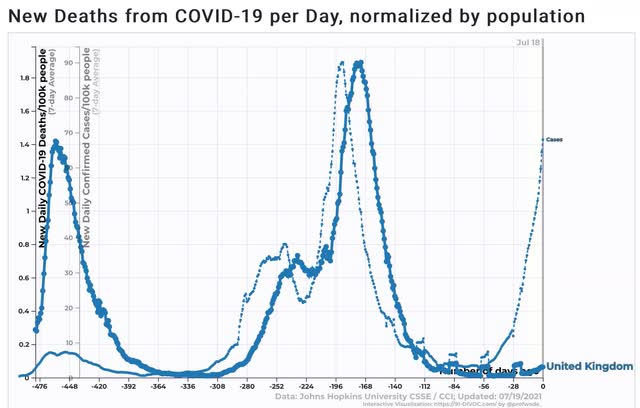
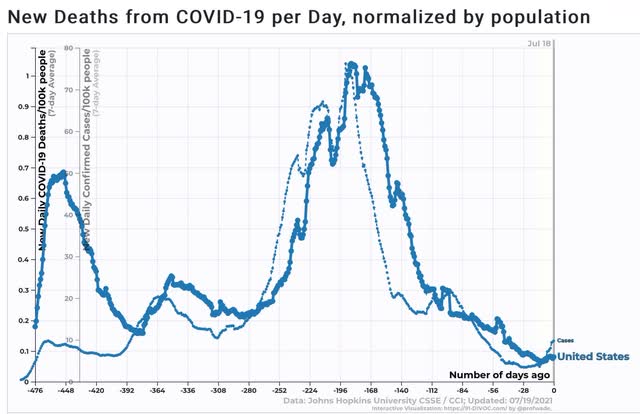
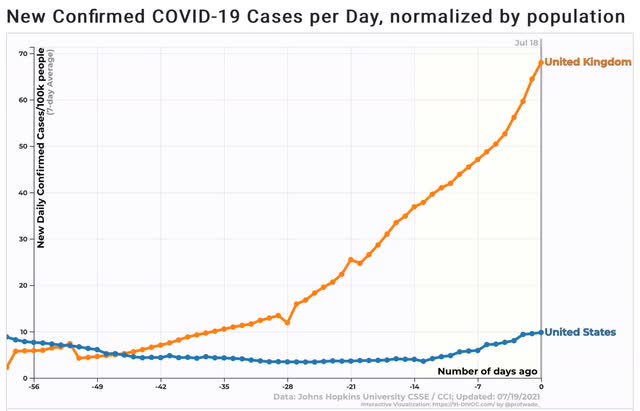
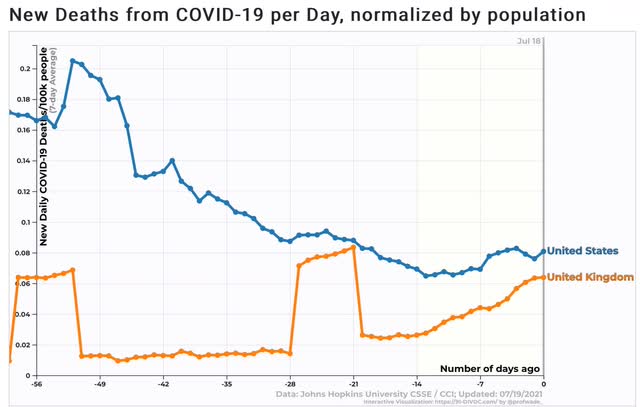
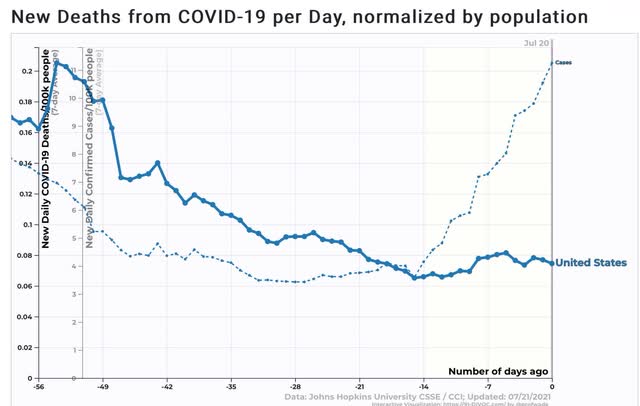
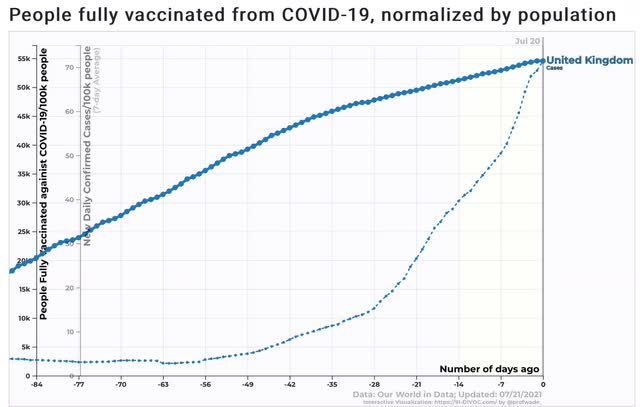
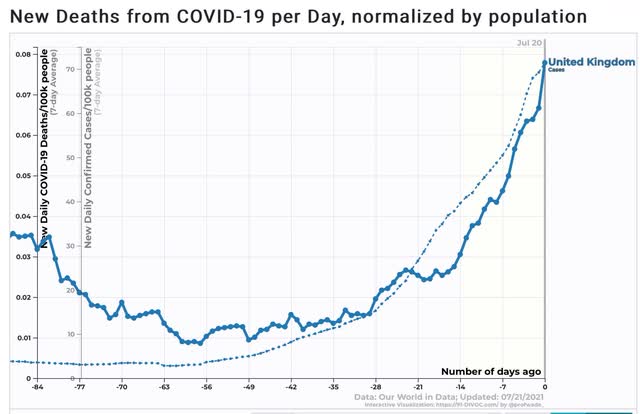
“In the near future, there appears to be bad news and *relatively* “good” news for the US. The bad news is that the “delta wave” is spreading, and we should expect a real outbreak on the order of last summer’s by early August. The *relatively* “good” news is that the death rate is likely not to be nearly so bad, if the experience in the UK is any guide.”
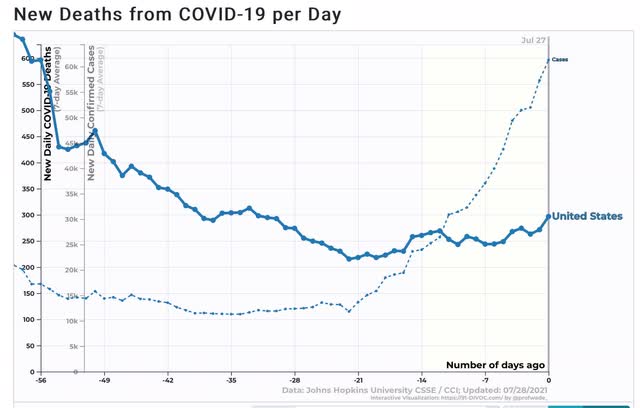
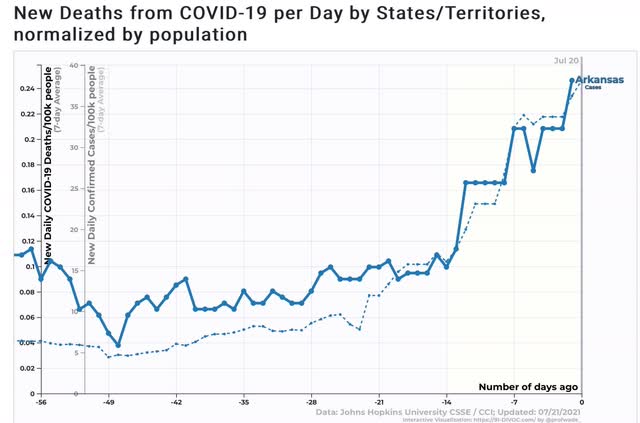
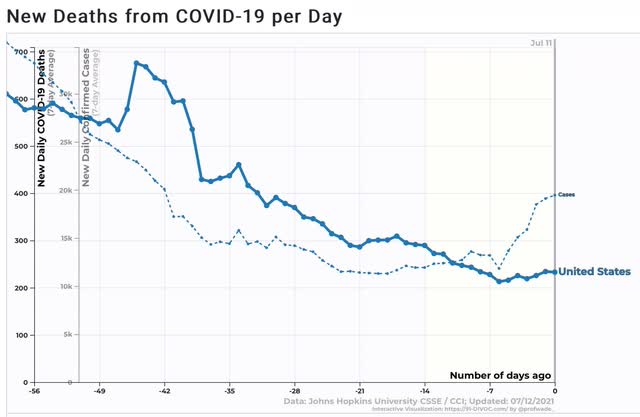
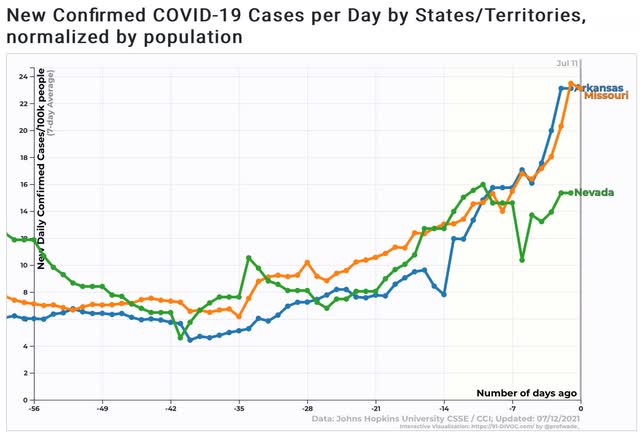
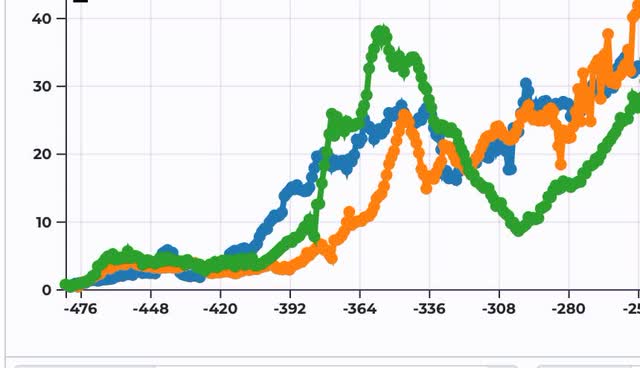
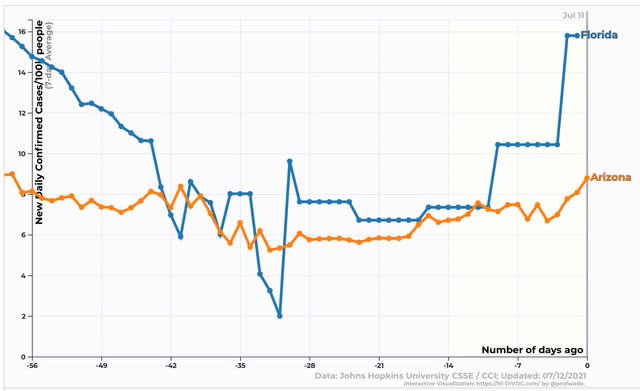
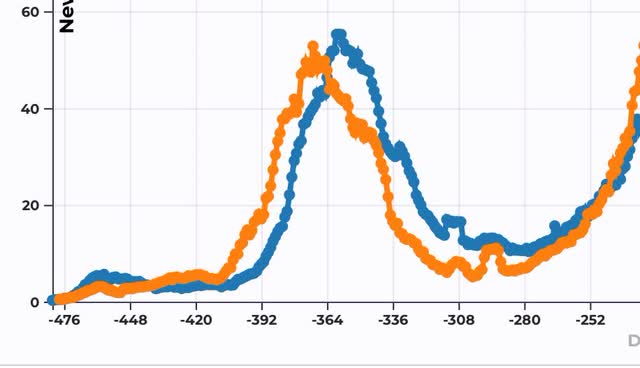
Cases have nearly tripled in the US in the past 2 weeks:

Since deaths lag by about 28 days, we haven’t nearly begun to see the kind of increase that is already baked into the cake.


- by New Deal democrat
First, a brief comment about the NBER’s declaration yesterday that the COVID recession ended in April 2020. I am not surprised at all that they chose that date. It has been clear for a year that the trough in economic activity across the board was that month (which we’ll see below as to housing, for example). Remember that a recovery starts when economic activity improves, even if that improvement is from totally awful to almost totally awful. The only thing that surprised me about the NBER announcement was that I expected them to wait for next week’s GDP report, which will probably show that Q2 set a new all time peak, surpassing Q1 2020 just before the pandemic.
Now, to housing ...
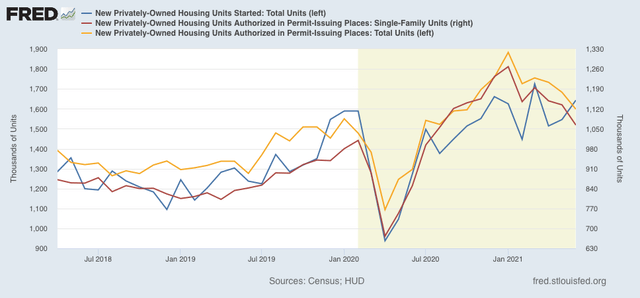
Housing permits, both in total (gold in the graph below) and the less volatile single family permits (red), both continued to decline in June, to the lowest level since last August. The more volatile and slightly lagging measure of housing starts (blue) increased, although they remained below their recent peak from this March and also last December:
Both as to permits and starts, the level of construction activity remains higher than its pre-pandemic peak. At the same time, the decline of slightly more than 15% in permits is consistent with a slowing down of economic growth next year.
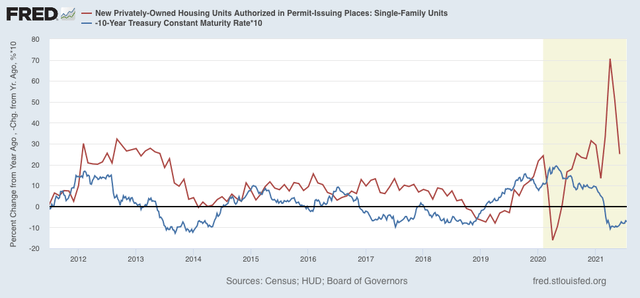
Finally, here is the YoY change in mortgage rates (red)(*10 for scale), inverted so that up = economic positive, and down = economic negative, compared with total permits (blue):
As I have said many times before, mortgage rates lead permits and starts. The big pandemic decline evaporated last July, so beginning next month, the YoY comparisons are going to be much more challenging. On the other hand, the renewed decline in mortgage rates in the past few weeks will at least temporarily put a floor under the decline in housing purchases.
- by New Deal democrat
An initial note: I am on vacation this week, so posting is likely to be sporadic. I’ll still hit the important data.


- by New Deal democrat
My “Weekly Indicators” post is up at Seeking Alpha.
All timeframes continue positive, but the renewed outbreak of COVID - indeed, its uncontrolled exponential spread - is the proverbial elephant in the room, and is quite likely to Bigfoot the entire forecast and nowcast. And with the many crosscurrents, is effect on the economy is fiendishly difficult to forecast.
As usual, clicking over and reading should be rewarding for you, and for me as well to the tune of a penny or two.
- by New Deal democrat


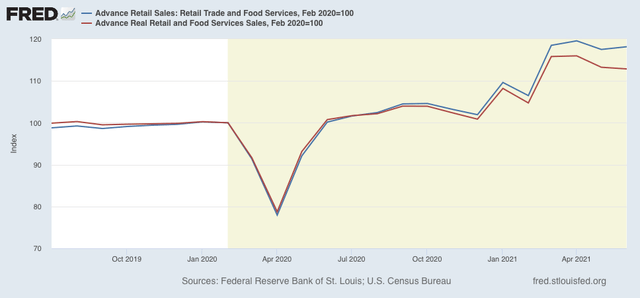
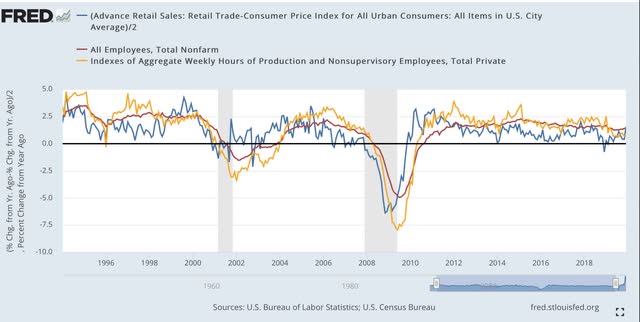
Next let’s turn to employment, because as I have pointed out many times, real retail sales (blue) tend to lead employment (red) and aggregate hours (gold) by about 3-4 months. Here’s the long term YoY look from 1993 through the end of 2019:
The long lags after the 2001 and 2008 recessions reflected the “China shock” as manufacturing jobs in particular were re-sourced to China in large wages after both recessions.
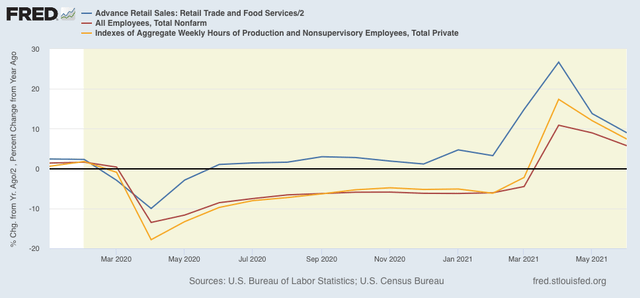
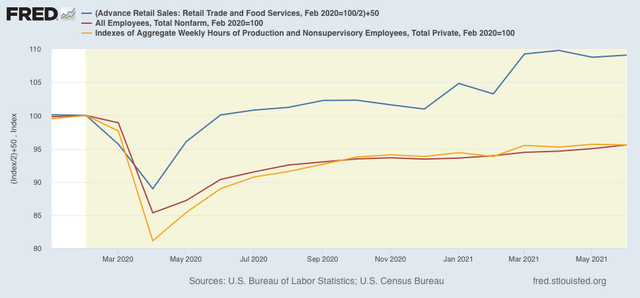
Here is the monthly update since the beginning of 2020 (note the huge difference in scale!):


- by New Deal democrat
New jobless claims are the most important weekly economic datapoint with regard to the effects of vaccination progress. At this point, it is also a test of how much the “delta wave” of new cases is setting economic progress back. Two weeks I wrote that, because progress in vaccinations had largely stalled, “that implies at least a stall in the decline in new claims, and - I actually suspect - an increase, perhaps to about 450,000 per week or so.”
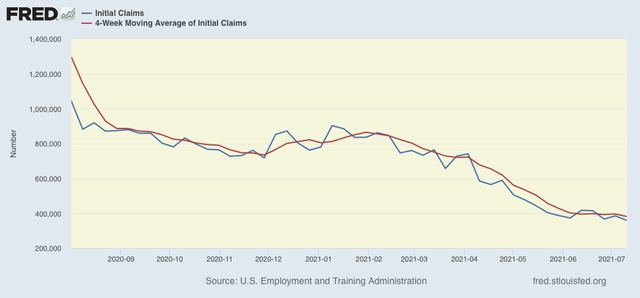
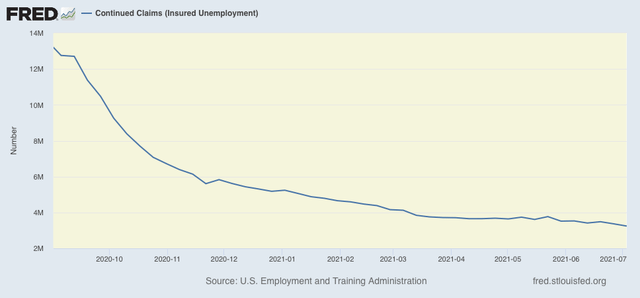
That certainly didn’t happen, at least this week. New jobless claims declined by 26,000 to 360,000, a new pandemic low. The 4 week average of claims set a new pandemic low, declining by 14,500 to 382,500. Here is the trend since last August:


- by New Deal democrat
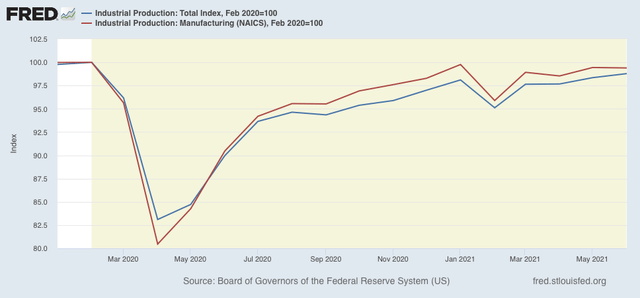
Industrial production is the King of Coincident Indicators. It is the single datum that most frequently coincides with the NBER determination of the beginning and end of recessions.

- by New Deal democrat
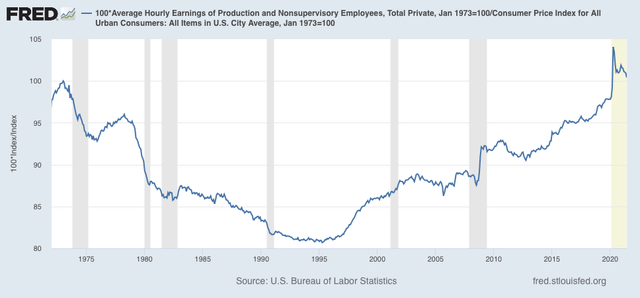
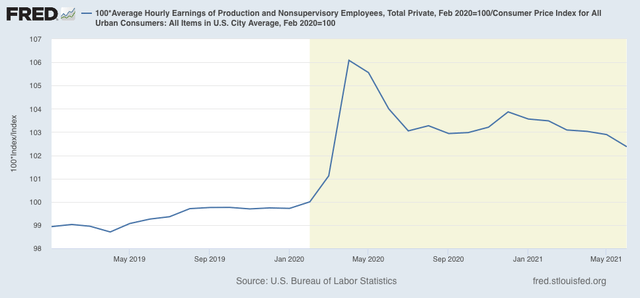
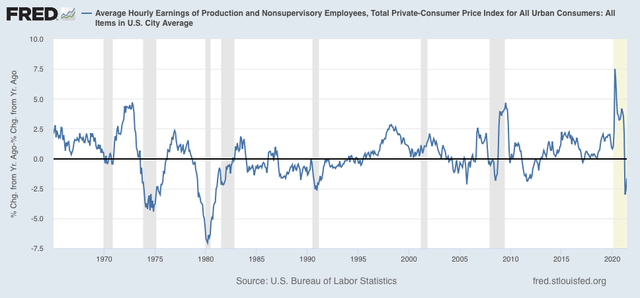
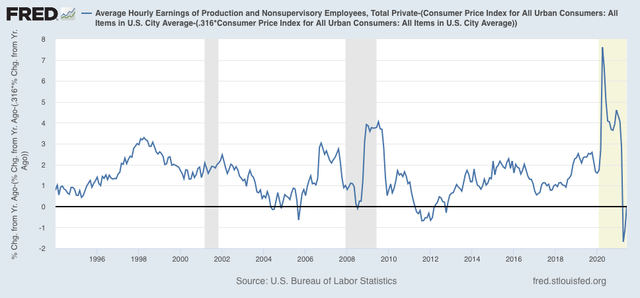
As I pointed out yesterday, the big increase in inflation over the past few months has made the YoY change in real wages for nonsupervisory workers negative. Let’s take a little closer look.


- by New Deal democrat
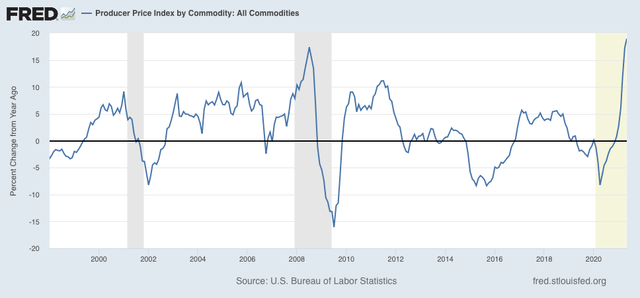
Let me start my take on this month’s inflation report with my concluding remarks last month: “this is not a big deal if it only lasts another month or two. But if the trend continues longer than that, it will begin to impact consumer spending, and it will get the Fed’s attention.”
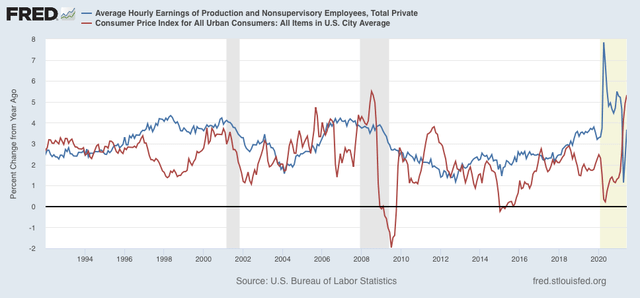
Well, it has definitely lasted another month. In spades. The 0.9% increase in June was the highest since June 2008’s 1.0% increase (driven by $4+ gas).(red in the graph below) More importantly, the 5.3% YoY increase is also the highest since summer 2008, and well in excess of the YoY average wage increase for nonsupervisory workers of 3.7% (blue):

This is going to get the Fed’s attention. They may not even wait another month.
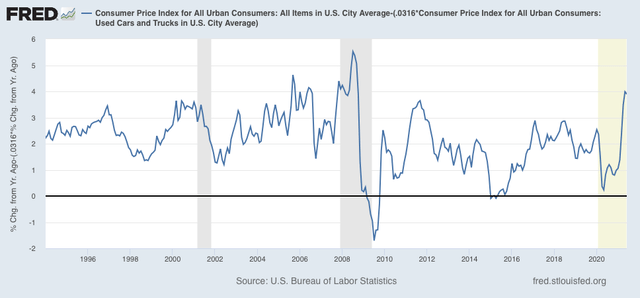
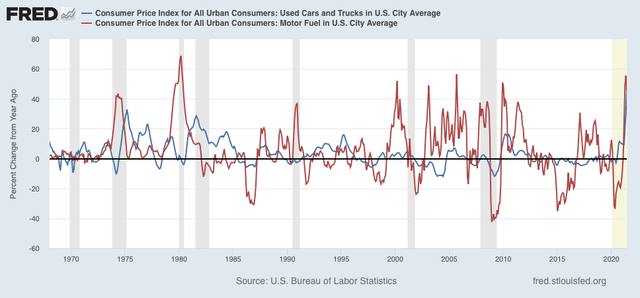
Be that as it may, the primary driver of this inflation is not wage increases, it is first and foremost a supply bottleneck in the production of new cars, which is driving insane demand for used cars (blue in the graph below), the prices of which are up 45.2% YoY. Secondarily it is the demand driven increase in gas usage, which has caused those prices to increase 44.8% YoY (red):

The spike in prices in used cars alone is responsible for about 1/3 of the total increase in prices last month. Used car prices, which are about 3.2% of the total weighting in the inflation index, rose 10.8% in just the past month! That nets out to over 0.3% of the total inflation number being just used cars.
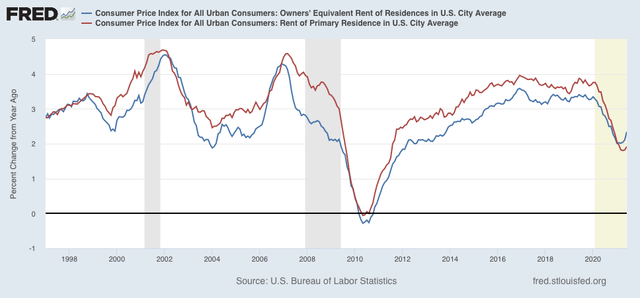
On the other hand, rent continues to be somnolent (as is “owners’ equivalent rent,” which is how the Census Bureau tries to measure house prices):

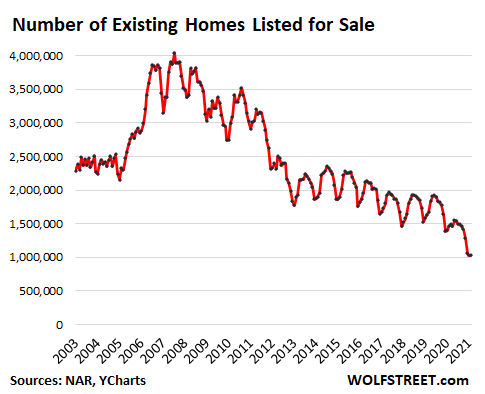
By the way, ultimately the house price spike has been driven by the fact that during the pandemic last year, existing homes placed on the market (which are about 90% of the typical housing market) declined precipitously compared with the typical year:

I expect both house prices and gas prices to work themselves out. Not only have home sales declined, but I expect most of the houses that were going to be placed on the market in 2020 to go to market over the next 12 to 24 months. This surge in existing home inventory is going to drive house prices down. Similarly, the travel bug from being cooped up at home during the pandemic is going to pass as well.
That leaves motor vehicles. As I wrote last month, I have no special insight into vehicle part supply chains, and in particular microchips, which have been fingered as a primary shortage.
But, hypothetically, would the Fed raising rates do anything about that shortage? The answer seems a pretty clear “NO,” so why deliberately slow down the rest of the economy to deal with a bottleneck that is beyond their control?

- by New Deal democrat
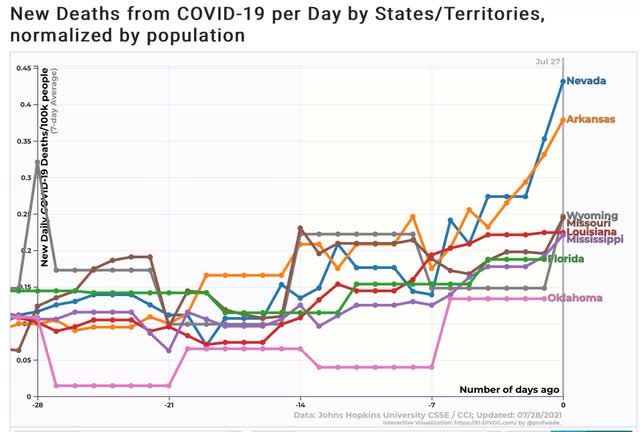
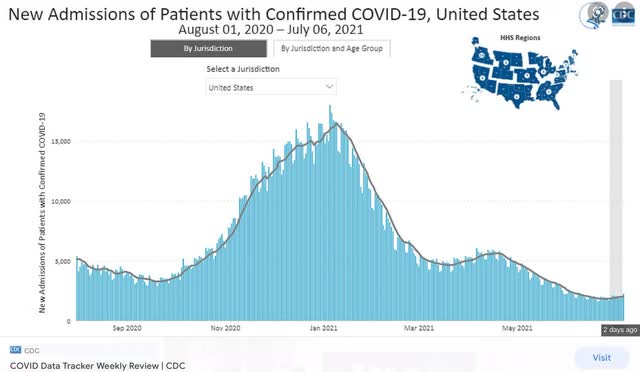
The completely unnecessary and preventable “delta wave” of COVID infections, hospitalizations, and deaths is now in force - all three metrics are now rising nationwide.


- by New Deal democrat
My Weekly Indicators post is up at Seeking Alpha.
To the surprise of many, interest rates have gone down in the past few weeks, to the point where they have resumed being a positive in my long leading model.
Meanwhile, as the “delta wave” of COVID builds in the unvaccinated States, once again the pandemic will begin to assert control over the economy, at least as to those sections of the country, and may override the leading signals from the model.
As usual, clicking through and reading will bring you up to date, and bring me a penny or two for my efforts.