- by New Deal democrat
First, a brief comment about the NBER’s declaration yesterday that the COVID recession ended in April 2020. I am not surprised at all that they chose that date. It has been clear for a year that the trough in economic activity across the board was that month (which we’ll see below as to housing, for example). Remember that a recovery starts when economic activity improves, even if that improvement is from totally awful to almost totally awful. The only thing that surprised me about the NBER announcement was that I expected them to wait for next week’s GDP report, which will probably show that Q2 set a new all time peak, surpassing Q1 2020 just before the pandemic.
Now, to housing ...
Housing permits, both in total (gold in the graph below) and the less volatile single family permits (red), both continued to decline in June, to the lowest level since last August. The more volatile and slightly lagging measure of housing starts (blue) increased, although they remained below their recent peak from this March and also last December: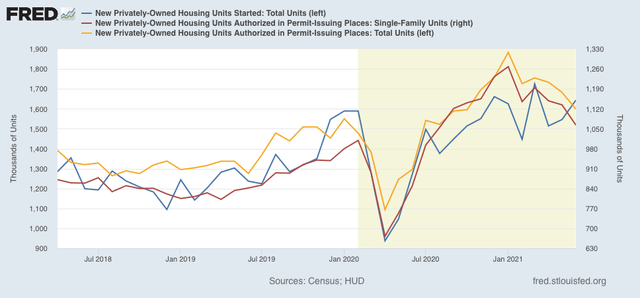
Both as to permits and starts, the level of construction activity remains higher than its pre-pandemic peak. At the same time, the decline of slightly more than 15% in permits is consistent with a slowing down of economic growth next year.
Finally, here is the YoY change in mortgage rates (red)(*10 for scale), inverted so that up = economic positive, and down = economic negative, compared with total permits (blue):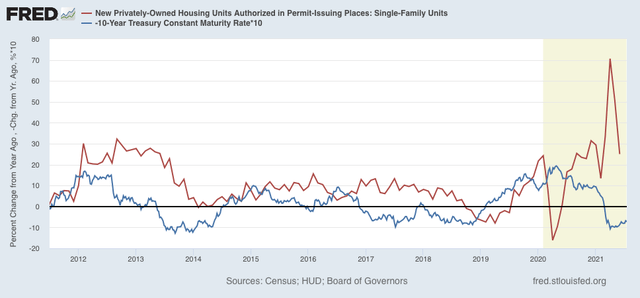
As I have said many times before, mortgage rates lead permits and starts. The big pandemic decline evaporated last July, so beginning next month, the YoY comparisons are going to be much more challenging. On the other hand, the renewed decline in mortgage rates in the past few weeks will at least temporarily put a floor under the decline in housing purchases.