Wednesday, December 21, 2011
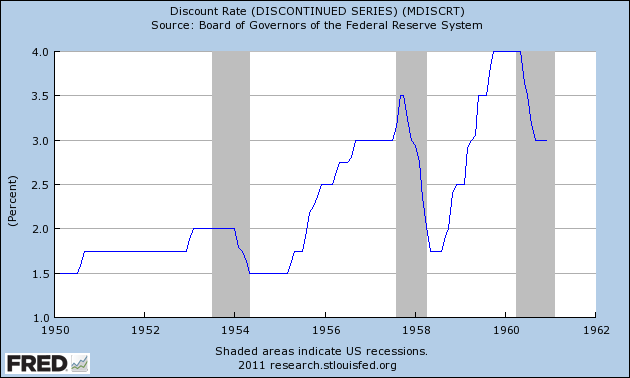
1950s: The Discount Rate and 1950 Inflation
The above chart shows the Federal Reserve's Discount Rate for the 1950s. Note that in the middle and end of the decade we see the Fed increasing rates to such a degree that they create a recession. Then we see the Fed lower rates during the recession to spur growth. This is what most people think of when they think of "recession and recovery."
That being said, let's take a look at inflation in the year 1950, as it explains the increase in the discount rate.
PPI continued to increase on a YOY rate, eventually reaching nearly 15%, while CPI continued to escalate as well, eventually hitting hear 6%. So -- what caused these price increases?
1.) Massive demand. PCEs increased at incredibly strong rates for the first three quarters of the year. This led to a classic case of demand pull inflation. Food prices were a big reason for the increase (which increased 4.8% from December 1949 to November 1950), as was an increase in house hold furnishings (which increased 9.1% from December 1949 to November 1950).
2.) The Korean War outbreak led to massive increases in raw material prices. As the ERP notes, 75% of industrial goods had increased in price by mid-October, 44% had risen 10% or more, and 26% were up 20% or more above the pre-Korean war levels.
As an aside, here are the charts from the Economic Report to the President for both Whole
sale and Consumer prices.
Is Manufacturing Making a Comback?
Over the last 6-9 months, we've seen various regional manufacturing surveys drop. However, two surveys released last week show improvement. First is the Empire State survey:
Then there was the Philly Fed index:
The Empire State Manufacturing Survey indicates that manufacturing activity improved in New York State in December. The general business conditions index rose nine points to 9.5, its highest level since May. The new orders index climbed above zero, to 5.1, and the shipments index advanced eleven points to 20.9. Input price increases steepened, with the prices paid index rising six points to 24.4. Selling prices increased only modestly, with the prices received index inching down to 3.5. Employment indexes were mixed, showing a slight increase in employment levels but a slight decrease in the length of the average workweek. Future indexes rose sharply for a second consecutive month, with the future general business conditions index climbing thirteen points to 52.3, suggesting a return to the high levels of optimism seen earlier in 2011.While the numbers are still low, they are improving.
Then there was the Philly Fed index:
Responses to the Business Outlook Survey this month suggest that regional manufacturing continued to improve in December. All of the broad indicators remained positive and suggest a modest expansion of activity. Increases in input prices were more widespread this month, and there was an uptick in the number of firms reporting increased prices for their own goods. The broadest indicator of future activity reflected a trend of increased optimism about growth over the next six months.Again, the numbers are low, but they did improve.
The diffusion index of current activity, the survey’s broadest measure of manufacturing conditions, remained positive for the third consecutive month and increased from 3.6 in November to 10.3 (see Chart). The percentage of firms reporting increases in activity (25 percent) exceeded the percentage reporting decreases (15 percent). The index for current new orders showed a similar improvement, increasing 8 points. The shipments index, at 6.7, was mostly flat. Twice as many firms reported declines in inventories (30 percent) as reported increases (15 percent) and the current inventory index fell 22 points to -14.9.
Labor market conditions continue to show overall improvement, but indexes edged down this month. Twenty percent of the firms reported an increase in employment; 10 percent reported a decrease. The current employment index remained positive at 10.7, only 1 point lower than in November. The average workweek index also remained positive but fell nearly 9 points.
Tuesday, December 20, 2011
Morning Market
Gold's technical collapse over the last few days has been extraordinary. Prices have moved through key support -- a long-term trend line -- and are now right about the 50 week EMA. Also note that the MACD has dropped as well, showing a complete lack of momentum.
The 6-month chart shows prices have moved through technical support, and have rebounded, hitting resistance at the 200 day EMA. The CMF shows a move out GLD and the MACD shows declining momentum.
I've boxed off the sharp drop in GLD prices on the 5-minute chart. Prices at first gapped lower by a wide margin, consolidated sideways, and then continued to move lower. For the last three days, prices have moved a bit higher, but not in a strong rally; instead, prices have simply gapped a bit higher and then held on.
Bonddad Linkfest
- The meme that refuses to die: government debt must be paid back
- Happy birthday, terrible Meredith Whitney call
- The XLF is walking a think line, too
- Don't know much about history, debt edition
- German business confidence rises
- Sweden cuts rates
- House Republicans push for new talks
- ECB warns of contagion
Year In Review: Where Did Growth Come From?
Let's continue looking at the year in review and see where we grew:
1.) PCEs continued to contribute fairly consistently all four quarters.
2.) Investment was a bit lackluster; it contributed some, but not in as a large a way as we would like.
3.) Exports played a very important role; while they were not the primary driver of growth, they contributed in three out of four quarters.
4.) Government spending (or the self-imposed austerity) actually contracted from growth.
Note the strong contributions of durable goods for the first two quarters. My guess is the first quarters pulled some growth forward from the third quarter -- which was also negatively impacted by the debt ceiling debacle. Service spending greatly accelerated in the third and fourth quarter.
First note that investment in equipment and software was strong throughout the last four quarter period. If businesses are scared to invest because of massive regulation, it sure doesn't show in the numbers. In two quarters massive contractions in inventories greatly effected the overall number. Note that residential investment is non-existent. In a solid recovery, we'd be seeing a heck of a lot more investment in this area. Finally, non-residential structures contributed in three out of four quarters.
1.) PCEs continued to contribute fairly consistently all four quarters.
2.) Investment was a bit lackluster; it contributed some, but not in as a large a way as we would like.
3.) Exports played a very important role; while they were not the primary driver of growth, they contributed in three out of four quarters.
4.) Government spending (or the self-imposed austerity) actually contracted from growth.
Note the strong contributions of durable goods for the first two quarters. My guess is the first quarters pulled some growth forward from the third quarter -- which was also negatively impacted by the debt ceiling debacle. Service spending greatly accelerated in the third and fourth quarter.
First note that investment in equipment and software was strong throughout the last four quarter period. If businesses are scared to invest because of massive regulation, it sure doesn't show in the numbers. In two quarters massive contractions in inventories greatly effected the overall number. Note that residential investment is non-existent. In a solid recovery, we'd be seeing a heck of a lot more investment in this area. Finally, non-residential structures contributed in three out of four quarters.
Finally, note that government spending took away from growth, with a big bite coming from national defense contractions and state and local cutbacks.
So, looking at these numbers, we see the following;
1.) Consumer spending is still increasing, although not as strongly as we would like.
2.) Lack of residential investment is really hurting the overall numbers.
3.) Business is still investing in a variety of equipment and software.
4.) The contraction in state and local budgets is also hurting overall growth as well.
5.) Exports are also playing a pretty important role in the expansion to date.
This is the beginning of the end of the housing bust
- by New Deal democrat
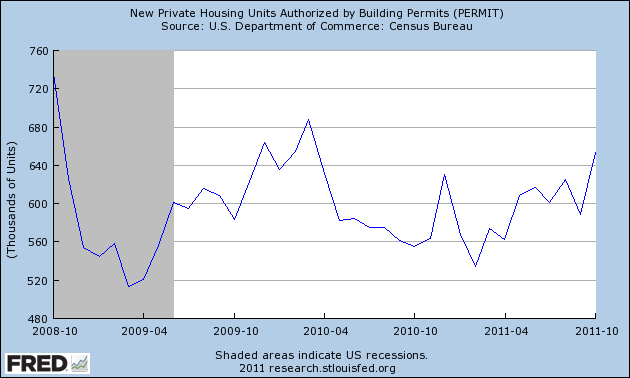
A month ago when housing starts and permits were reported, I wrote: Psst: Is this the beginning of the end of the housing bust? With this morning's report of 681,000 permits issued, I believe we can affirmatively answer, YES.
As I said last month, housing construction is a long leading indicator, indeed along with interest rates probably the most important one. So those commentators who say that we won't get housing improvement until we have job improvement have causation exactly backwards. Rather, it is much more likely that we won't get more meaningful job improvement until we have more meaningful housing improvement. Further, the decline in housing starts and permits after the expiration of the $8000 housing credit was probably an important factor in the slowdown in GDP earlier this year, and as I wrote last week, probably plays a role in ECRI's recession call.
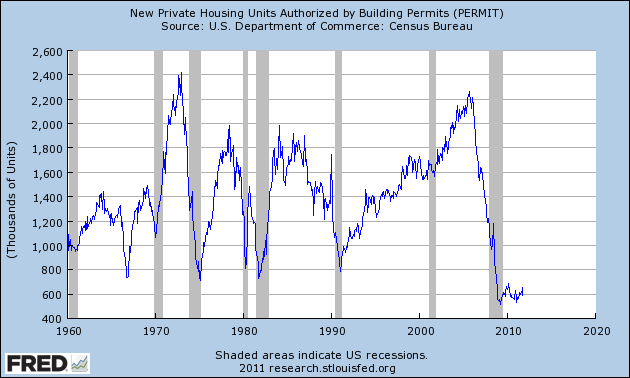
This morning's report of 681,000 housing permits is with the exception of the month when the $8000 housing credit ended, the highest in 3 years [note: the St. Louis FRED hasn't updated its graphs yet, so the 4 graphs below do not include today's report]:

In the past it has typically taken an improvement of 200,000 housing starts from the bottom to signal that a housing-led expansion has begun:

With November's report we are 85% of the way there from the March 2009 bottom of 513,000.
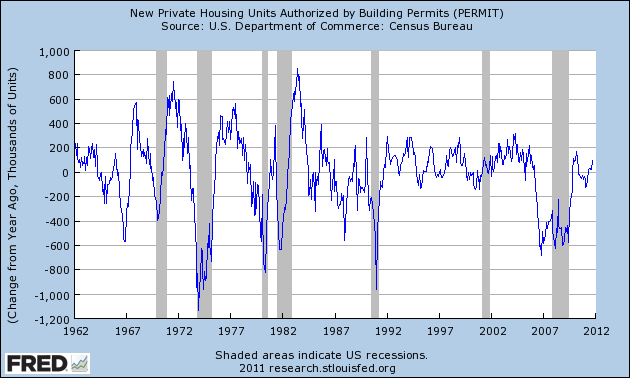
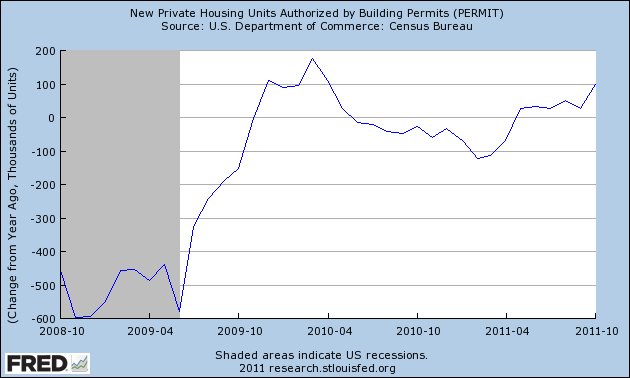
Another way of looking at housing and expansions is to measure the YoY improvement in the raw numbers. Typically in expansions there have been sustained periods of 200,000+ growth YoY:

With today's number we are 60% of the way there, for the first time without help from the housing credit:

Additionally, per Bill McBride a/k/a Calculated Risk, there is a strong leading relationship between housing starts and the unemployment rate, so a confirmed uptrend should mean a reduction in the unemployment rate.
While by no means are we at the end of the housing bust, today's number serves as confirmation that we are at least at the beginning of the end.
A month ago when housing starts and permits were reported, I wrote: Psst: Is this the beginning of the end of the housing bust? With this morning's report of 681,000 permits issued, I believe we can affirmatively answer, YES.
As I said last month, housing construction is a long leading indicator, indeed along with interest rates probably the most important one. So those commentators who say that we won't get housing improvement until we have job improvement have causation exactly backwards. Rather, it is much more likely that we won't get more meaningful job improvement until we have more meaningful housing improvement. Further, the decline in housing starts and permits after the expiration of the $8000 housing credit was probably an important factor in the slowdown in GDP earlier this year, and as I wrote last week, probably plays a role in ECRI's recession call.
This morning's report of 681,000 housing permits is with the exception of the month when the $8000 housing credit ended, the highest in 3 years [note: the St. Louis FRED hasn't updated its graphs yet, so the 4 graphs below do not include today's report]:

In the past it has typically taken an improvement of 200,000 housing starts from the bottom to signal that a housing-led expansion has begun:

With November's report we are 85% of the way there from the March 2009 bottom of 513,000.
Another way of looking at housing and expansions is to measure the YoY improvement in the raw numbers. Typically in expansions there have been sustained periods of 200,000+ growth YoY:

With today's number we are 60% of the way there, for the first time without help from the housing credit:

Additionally, per Bill McBride a/k/a Calculated Risk, there is a strong leading relationship between housing starts and the unemployment rate, so a confirmed uptrend should mean a reduction in the unemployment rate.
While by no means are we at the end of the housing bust, today's number serves as confirmation that we are at least at the beginning of the end.
1950: GDP and Contributions to Growth
1950 was a year of incredibly strong growth. We see percent changes from the preceding quarter of 17.2%, 12.7%, 16.6% and 7.2%. For the entire year, we see investment and PCEs alternating as the primary driver of growth. The incredibly strong increase in PCE's in the third quarter was caused by mass buying in anticipation of shortages because of the Korean War.
Delving deeper into the gross private domestic investment numbers, we see that inventory stockpiling was one of the primary drivers. Interestingly, this reminds of this latest expansion when inventory rebuilds were part of the growth story, which was vehemently denied as being real economic growth by many commentators. Also note there was a pick-up in fixed investment in the second and third quarter.
PCes were growing strongly in the first two quarters, but really accelerated in the third quarter, as consumers stocked up on durable goods -- again, in anticipation of coming shortages. PCEs contracted strongly in the fourth quarter. It makes sense to look at the strong third quarter numbers as pulling fourth quarter numbers forward.
Helping spur the PCE binge was an increase in consumer credit, which had been increasing for the preceding two years. From the 1951 Economic Report to the President:
Morning Market
Despite yesterday's price action, the SPYs are still in a consolidation pattern with the daily chart giving us no real clues as to what direction the ultimate break will be in.
The 5-minute chart shows an overall, slightly downward motion for the last 20 days. We see a pattern of lower highs and lower lows through last Tuesday with prices consolidating right above 121.5 for the last three days. Yesterday, prices broke below this level in the AM and then consolidated their move for most of the remainder of the day before moving sharply lower at the close.
In contrast, we see the long-end of the Treasury market moving sharply higher over the last 5 days, with prices advancing in two waves.
In contrast to the SPYs, the TLTs daily chart shows a decent rally taking place, with the chart printing fairly strong bars along with a bullish EMA and MACD picture.
So, in short, we're back to the situation of a few weeks ago; as stocks sell-off, the treasury market rises as it catches a safety bid.
This is the real winner of all the latest movement in the markets: the dollar. After breaking through resistance, it has consolidated its gains, but not fallen sharply enough to fall below the EMAs -- all of which are rising. Momentum is also positive.
The 5-minute chart shows an overall, slightly downward motion for the last 20 days. We see a pattern of lower highs and lower lows through last Tuesday with prices consolidating right above 121.5 for the last three days. Yesterday, prices broke below this level in the AM and then consolidated their move for most of the remainder of the day before moving sharply lower at the close.
In contrast, we see the long-end of the Treasury market moving sharply higher over the last 5 days, with prices advancing in two waves.
In contrast to the SPYs, the TLTs daily chart shows a decent rally taking place, with the chart printing fairly strong bars along with a bullish EMA and MACD picture.
So, in short, we're back to the situation of a few weeks ago; as stocks sell-off, the treasury market rises as it catches a safety bid.
This is the real winner of all the latest movement in the markets: the dollar. After breaking through resistance, it has consolidated its gains, but not fallen sharply enough to fall below the EMAs -- all of which are rising. Momentum is also positive.
Morning Market -- Beware False Breakouts
Over the last few months, the markets have been consolidating. However, in the low volume environment of holiday trading, it appears we may have a break-out.
On the weekly chart, we see a strong candle breaking through upside resistance. The MACD is increasing (and is just about to move into positive territory) and the volume indicators are slightly bullish.
On the daily chart, we see more detail of the break-out. First, the move is on very low volume on a weak candle. The volume indicators are weakly positive and the MACD is weakly bullish. In short, there is nothing on this chart to show a strong break-out, but there is technical confirmation.
The big reason for the move was a strong surge at the end of trading which was most likely technical buying.
In addition, we see money moving out of the treasury markets:
The IEIs have broken key support.
The IEFs have broken support -- although weakly, as have
the TLTs.
So, we have a major equity index weakly breaking resistance, and some money moving out of the treasury market, although doing so weakly. Notice that on both ends of this situation, I'm using he work "weak." What we're not seeing is a strong surge into the SPYs or out of the treasury market; the movement is far more technical. That does not mean it's not real, or couldn't lead to profits; but it does mean we need to look under the hood at various market sectors to see where the growth is coming from. And this is where the break-out runs into serious problems.
The move higher is coming from defensive sectors -- consumer staples, utilities and health care. These are sectors that we would expect to rally when investors are concerned about what lies ahead.
This is not to say these are not important sectors. Combined, they comprise 27.8% of the S and P 500. And this is also not to say a real break-out could not be happening. It's just the evidence does not lead me to conclude the markets rose because people are excited by the future. Instead, it looks like the rally was caused by people saying, "we are scared about the future and want to put our money into market sectors that are safer when things get tough."
On the weekly chart, we see a strong candle breaking through upside resistance. The MACD is increasing (and is just about to move into positive territory) and the volume indicators are slightly bullish.
On the daily chart, we see more detail of the break-out. First, the move is on very low volume on a weak candle. The volume indicators are weakly positive and the MACD is weakly bullish. In short, there is nothing on this chart to show a strong break-out, but there is technical confirmation.
The big reason for the move was a strong surge at the end of trading which was most likely technical buying.
In addition, we see money moving out of the treasury markets:
The IEIs have broken key support.
The IEFs have broken support -- although weakly, as have
the TLTs.
So, we have a major equity index weakly breaking resistance, and some money moving out of the treasury market, although doing so weakly. Notice that on both ends of this situation, I'm using he work "weak." What we're not seeing is a strong surge into the SPYs or out of the treasury market; the movement is far more technical. That does not mean it's not real, or couldn't lead to profits; but it does mean we need to look under the hood at various market sectors to see where the growth is coming from. And this is where the break-out runs into serious problems.
The move higher is coming from defensive sectors -- consumer staples, utilities and health care. These are sectors that we would expect to rally when investors are concerned about what lies ahead.
This is not to say these are not important sectors. Combined, they comprise 27.8% of the S and P 500. And this is also not to say a real break-out could not be happening. It's just the evidence does not lead me to conclude the markets rose because people are excited by the future. Instead, it looks like the rally was caused by people saying, "we are scared about the future and want to put our money into market sectors that are safer when things get tough."
Monday, December 19, 2011
Household deleveraging stalls
- by New Deal democrat
The Federal Reserve's report on household debt burdens was released last week, covering the July - September quarter of 2011. According to the bank,
With one important exception, both measures had declined almost relentlessly since the end of 2007 -- until now. Here is the updated graph:

Debt service payments (blue line, left scale) for the second quarter, which had been initially reported at 11.09%, were revised upward to 11.13%. In the third quarter they fell back to 11.09%. Total financial obligations (red line, right scale) for the second quarter, which had been initially reported at 16.09%. were revised upward to 16.15% and remained there for the third quarter.
While the debt service ratio, as presently reported, is still slowly declining, total financial obligations have completely stalled -- for a very interesting reason: as the Fed reported, total obligations for homeowners did continue to decrease, but rents have actually increased! Since the housing bust has pushed at least several million people out of houses and into rental units, for the last year rents have been rising. The YoY increased peaked in August at +4.6%, and as of Friday's November CPI report, is still +2.8%. Needless to say, this is going to continue to change the rent vs. own calculation in favor of ownership. If prospective home buyers become convinced that house prices are close to bottoming, that market could change quite swiftly.
I have no idea if this is merely a pause, or whether this will establish a multi-year bottom in household deleveraging. In the longer term, for a sustainable economic expansion, there must be adequate deleveraging by households, housing prices must bottom at least nominally as well as new housing construction begin to pick up, and the Oil choke collar must be broken. It does appear that very slowly all of those things are beginning to happen.
The Federal Reserve's report on household debt burdens was released last week, covering the July - September quarter of 2011. According to the bank,
The household debt service ratio (DSR) is an estimate of the ratio of debt payments to disposable personal income. Debt payments consist of the estimated required payments on outstanding mortgage and consumer debt.
The financial obligations ratio (FOR) adds automobile lease payments, rental payments on tenant-occupied property, homeowners' insurance, and property tax payments to the debt service ratio.
With one important exception, both measures had declined almost relentlessly since the end of 2007 -- until now. Here is the updated graph:

Debt service payments (blue line, left scale) for the second quarter, which had been initially reported at 11.09%, were revised upward to 11.13%. In the third quarter they fell back to 11.09%. Total financial obligations (red line, right scale) for the second quarter, which had been initially reported at 16.09%. were revised upward to 16.15% and remained there for the third quarter.
While the debt service ratio, as presently reported, is still slowly declining, total financial obligations have completely stalled -- for a very interesting reason: as the Fed reported, total obligations for homeowners did continue to decrease, but rents have actually increased! Since the housing bust has pushed at least several million people out of houses and into rental units, for the last year rents have been rising. The YoY increased peaked in August at +4.6%, and as of Friday's November CPI report, is still +2.8%. Needless to say, this is going to continue to change the rent vs. own calculation in favor of ownership. If prospective home buyers become convinced that house prices are close to bottoming, that market could change quite swiftly.
I have no idea if this is merely a pause, or whether this will establish a multi-year bottom in household deleveraging. In the longer term, for a sustainable economic expansion, there must be adequate deleveraging by households, housing prices must bottom at least nominally as well as new housing construction begin to pick up, and the Oil choke collar must be broken. It does appear that very slowly all of those things are beginning to happen.
Year End Review: GDP and Its Macro Components
It's nearing the end of the year, which seems to be an appropriate time to look back at the last year (actually 5 quarters) to get a sense of where we are and what the future might hold. Let's start with a look at GDP and it's macro level components.
The above chart tells us an awful lot of information. First, we're growing but at a lackluster pace. The strongest quarters we've seen in the last five quarters is a little under 2.5% -- hardly anything to get excited about, In addition, the first quarter of this year was just strong enough to keep us positive, but not much more. Finally, the third quarter number still has one more revision to go through.
PCEs have been increasing at a decent but not strong rate. The highest rate we've seen in the last five quarters is 3.5%, but the other numbers in the chart indicate the average and median PCE number for the last 5 quarters are actually fairly low. In short, people are spending, but not a lot.
Gross private domestic investment has bounced around a great deal -- expanding over 7.5% in 3Q10, but than contracting nearly that amount in 4Q10. We'll look at this number in more detail this week to see what caused these gyrations.
First, remember the chart above is for quarters, not single months. In short, the U.S. is still a net importer, although the rate of imports has steadied over the last 5 quarters.
Government spending has also gyrated pretty wildly over the last 5 quarters, with a fairly extreme contraction at the beginning of this year and a mild contraction at the end of last year.
The above chart tells us an awful lot of information. First, we're growing but at a lackluster pace. The strongest quarters we've seen in the last five quarters is a little under 2.5% -- hardly anything to get excited about, In addition, the first quarter of this year was just strong enough to keep us positive, but not much more. Finally, the third quarter number still has one more revision to go through.
PCEs have been increasing at a decent but not strong rate. The highest rate we've seen in the last five quarters is 3.5%, but the other numbers in the chart indicate the average and median PCE number for the last 5 quarters are actually fairly low. In short, people are spending, but not a lot.
Gross private domestic investment has bounced around a great deal -- expanding over 7.5% in 3Q10, but than contracting nearly that amount in 4Q10. We'll look at this number in more detail this week to see what caused these gyrations.
First, remember the chart above is for quarters, not single months. In short, the U.S. is still a net importer, although the rate of imports has steadied over the last 5 quarters.
Government spending has also gyrated pretty wildly over the last 5 quarters, with a fairly extreme contraction at the beginning of this year and a mild contraction at the end of last year.
Morning Market
The year end consolidation of all the markets continues. Notice how none of the major averages is breaking out in any meaningful way. All the EMAs are in a tight bunch and the MACDs are giving lack-luster signals. Until we see a move above or below any of the trend lines, the markets are in "consolidation mode." Also -- there are no strong indicators for a move in either direction on any of the charts.
After consolidating last week, oil dropped sharply on Wednesday and continued its decline throughout the week, eventually resting near the 200 day EMA. The EU situation has lowered possible future oil demand. Additionally, the strong dollar is lowering the price of all commodities.
The dollar has clearly broken through upside resistance, and is now moving lower as traders take profits. Look for the dollar to establish support at either the trend line of the shorter EMAs. Notice the EMAs are now in a very bullish posture -- all are rising, the shorter are above the longer and prices are above all. Also note the strength of the candle that pushed through resistance and the weakness of the candles on the sell-off.
Saturday, December 17, 2011
Weekly Indicators: Dr. Jekyll and Mr. Hyde edition
- by New Deal democrat
Monthly data was decidedly mixed, with a negative bias. The only unequivocally good news was the improvement in the Empire State and Philadelphia Fed Indexes. These have completely wiped out their post debt debacle weakness. Retail sales, both nominal and real, were up a weak 0.2%. On the other hand, both industrial production and capacity utilization fell. The trend of these is especially concerning. During the first 12 months of the expansion, Industrial production grew at a rate of 8% YoY. For the next 12 months, the rate of growth was about 3.5%. For the last 4 months, the annualised growth rate is only 2.5%, and rolling over negative in 1Q 2012 is a non-trivial possibility. CPI was actually slightly negative, but rounded to 0. This is the second month in a row where the actual number has been negative. By my definition, one more negative month of CPI puts us in a deflationary scenario. Commodity deflation signals weakness. Further, the yield curve is useless as a positive long leading indicator when the period one year later is in deflation - and the yield curve has consistently been the most positive element of the LEI.
The high frequency weekly indicators are at the point where holiday seasonality strongly affects their week over week performance. YoY comparisons are more important, but whether those comparisons are improving or deteriorating is most important. These exhibited a severe case of split personality this week. A few were strongly positive, but several more were worryingly negative. I again remind new readers that my "Weekly Indicators" column is not designed to be a big picture forecast of the future, but rather by use of high frequency data to capture an up-to-the-minute snapshot of the economy as it is right now.
Let me start with the most severe case of split personality. The BLS reported that Initial jobless claims declined by 15,000 to 366,000. This is the lowest figure in over 3 1/2 years. The four week average declined by 5500 to 387,750. Take both of these with grains of salt since this is the second week where year-end seasonality is significant. Even if the numbers are slightly overcompensating for seasonal factors (not unusual), the trend is still very good.
On the other hand, adjusting +1.07% due to the 2011 tax compromise, the Daily Treasury Statement showed that withholding for the first 11 days of December stood at $74.7 B vs. $77.8 B a year ago. For the last 20 reporting days, $129.7 B was collected vs. $130.9 B a year ago, a loss of $1.2 B or -1.1%. I have tested this result by checking 4 week Tuesday to Tuesday and Wednesday to Wednesday numbers, and those results are even worse. Simply put, there do not appear to be any day-of-the-week or other quirks in this measurement, so this is a worrying negative result.
Finally, the American Staffing Association Index rebounded by 3 to 92 last week. This is entirely due to the previous Thanksgiving week's seasonality. This series is now just barely below last year's levels, after stagnating earlier this year.
Rail traffic and asking prices for housing also turned in very good reports. The American Association of Railroads reported that total carloads increased 3.4% YoY, up about 17,600 carloads YoY to 538,300. Intermodal traffic (a proxy for imports and exports) was up 6900 carloads, or 3.0% YoY. The remaining baseline plus cyclical traffic increased 8600 carloads or 3.7% YoY. Total rail traffic has staged an impressive rebound in the last 3 months.
For the third week in a row, YoY weekly median asking house prices from 54 metropolitan areas at Housing Tracker were positive, up +1.1% YoY. The areas with YoY% increases in price increased by 4 to 25, just two short of 1/2 of all areas. Only Chicago continued to have a double-digit YoY% decline.
Mortgage applications were more tepid. The Mortgage Bankers' Association reported that seasonally adjusted purchase mortgage applications decreased -8.2% last week, almost exactly reversing the gain of the week before. On a YoY basis, purchase applications were down -4.3%. The actual reading remains firmly within the range that purchase mortgage applications have been in since May 2010. Refinancing rose +9.3% w/w, to a multi-month high.
Retail same store sales were decidedly mixed for the second week in a row, as one service reported an outright YoY decline for the first time all year. The ICSC reported that same store sales for the week ending December 10 increased 2.9% YoY, but were down -0.1% week over week. Shoppertrak, however, reported that YoY sales decreased -1.9% YoY but reversed last week's big decline, with a 10.6% gain. For further contrast, Gallup's daily tracking of consumer spending continues to show solid YoY gains.
Money supply has been flat or down since its Euro crisis induced tsunami of several months ago. M1 decreased -0.1% last week, and also declined -0.2% month over month. It is now up 18.1% YoY, so Real M1 remains up 14.7%. This is about 6% under its peak YoY gain several months ago. M2 was up +0.2% w/w but unchanged month over month. It remains up 9.5% YoY, so Real M2 was up 6.1%. This is also significantly less than its YoY reading at the crest of the tsunami.
Finally, signs of weakness continue in credit spreads and gasoline usage. Weekly BAA commercial bond rates increased .02% to 5.30%. Yields on 10 year treasury bonds were flat at to 2.04%. In the last month, spreads have widened again, representing increasing weakness.
The Oil choke collar loosened, as Oil closed at $93.53 a barrel on Friday. This slightly below the recession-trigger level calculated by analyst Steve Kopits. Gas at the pump was flat at $3.29 a gallon. Measured this way, we probably are only about $.05 above the 2008 recession trigger level. Gasoline usage, at 8666 M gallons vs. 9349 M a year ago, was off a whopping -7.3%. The 4 week moving average is off -4.5%. For the last 2 weeks we have returned to the dramatically less usage YoY that started in March and intensified since July.
It is extremely difficult to reconcile these Dr. Jekyll and Mr. Hyde reports. Are we still on the rebound, or on the immediate cusp of a recession as ECRI has insisted? I am inclined to believe that, whether or not there is an actual recession, 1Q 2012 is likely to be the epicenter of weakness, not least because it is 12 months after the large spike in gasoline prices - and thus the point of maximum impact on the economy. But global weakness should mean lower gas prices, and recharged batteries for American consumers and businesses.
Monthly data was decidedly mixed, with a negative bias. The only unequivocally good news was the improvement in the Empire State and Philadelphia Fed Indexes. These have completely wiped out their post debt debacle weakness. Retail sales, both nominal and real, were up a weak 0.2%. On the other hand, both industrial production and capacity utilization fell. The trend of these is especially concerning. During the first 12 months of the expansion, Industrial production grew at a rate of 8% YoY. For the next 12 months, the rate of growth was about 3.5%. For the last 4 months, the annualised growth rate is only 2.5%, and rolling over negative in 1Q 2012 is a non-trivial possibility. CPI was actually slightly negative, but rounded to 0. This is the second month in a row where the actual number has been negative. By my definition, one more negative month of CPI puts us in a deflationary scenario. Commodity deflation signals weakness. Further, the yield curve is useless as a positive long leading indicator when the period one year later is in deflation - and the yield curve has consistently been the most positive element of the LEI.
The high frequency weekly indicators are at the point where holiday seasonality strongly affects their week over week performance. YoY comparisons are more important, but whether those comparisons are improving or deteriorating is most important. These exhibited a severe case of split personality this week. A few were strongly positive, but several more were worryingly negative. I again remind new readers that my "Weekly Indicators" column is not designed to be a big picture forecast of the future, but rather by use of high frequency data to capture an up-to-the-minute snapshot of the economy as it is right now.
Let me start with the most severe case of split personality. The BLS reported that Initial jobless claims declined by 15,000 to 366,000. This is the lowest figure in over 3 1/2 years. The four week average declined by 5500 to 387,750. Take both of these with grains of salt since this is the second week where year-end seasonality is significant. Even if the numbers are slightly overcompensating for seasonal factors (not unusual), the trend is still very good.
On the other hand, adjusting +1.07% due to the 2011 tax compromise, the Daily Treasury Statement showed that withholding for the first 11 days of December stood at $74.7 B vs. $77.8 B a year ago. For the last 20 reporting days, $129.7 B was collected vs. $130.9 B a year ago, a loss of $1.2 B or -1.1%. I have tested this result by checking 4 week Tuesday to Tuesday and Wednesday to Wednesday numbers, and those results are even worse. Simply put, there do not appear to be any day-of-the-week or other quirks in this measurement, so this is a worrying negative result.
Finally, the American Staffing Association Index rebounded by 3 to 92 last week. This is entirely due to the previous Thanksgiving week's seasonality. This series is now just barely below last year's levels, after stagnating earlier this year.
Rail traffic and asking prices for housing also turned in very good reports. The American Association of Railroads reported that total carloads increased 3.4% YoY, up about 17,600 carloads YoY to 538,300. Intermodal traffic (a proxy for imports and exports) was up 6900 carloads, or 3.0% YoY. The remaining baseline plus cyclical traffic increased 8600 carloads or 3.7% YoY. Total rail traffic has staged an impressive rebound in the last 3 months.
For the third week in a row, YoY weekly median asking house prices from 54 metropolitan areas at Housing Tracker were positive, up +1.1% YoY. The areas with YoY% increases in price increased by 4 to 25, just two short of 1/2 of all areas. Only Chicago continued to have a double-digit YoY% decline.
Mortgage applications were more tepid. The Mortgage Bankers' Association reported that seasonally adjusted purchase mortgage applications decreased -8.2% last week, almost exactly reversing the gain of the week before. On a YoY basis, purchase applications were down -4.3%. The actual reading remains firmly within the range that purchase mortgage applications have been in since May 2010. Refinancing rose +9.3% w/w, to a multi-month high.
Retail same store sales were decidedly mixed for the second week in a row, as one service reported an outright YoY decline for the first time all year. The ICSC reported that same store sales for the week ending December 10 increased 2.9% YoY, but were down -0.1% week over week. Shoppertrak, however, reported that YoY sales decreased -1.9% YoY but reversed last week's big decline, with a 10.6% gain. For further contrast, Gallup's daily tracking of consumer spending continues to show solid YoY gains.
Money supply has been flat or down since its Euro crisis induced tsunami of several months ago. M1 decreased -0.1% last week, and also declined -0.2% month over month. It is now up 18.1% YoY, so Real M1 remains up 14.7%. This is about 6% under its peak YoY gain several months ago. M2 was up +0.2% w/w but unchanged month over month. It remains up 9.5% YoY, so Real M2 was up 6.1%. This is also significantly less than its YoY reading at the crest of the tsunami.
Finally, signs of weakness continue in credit spreads and gasoline usage. Weekly BAA commercial bond rates increased .02% to 5.30%. Yields on 10 year treasury bonds were flat at to 2.04%. In the last month, spreads have widened again, representing increasing weakness.
The Oil choke collar loosened, as Oil closed at $93.53 a barrel on Friday. This slightly below the recession-trigger level calculated by analyst Steve Kopits. Gas at the pump was flat at $3.29 a gallon. Measured this way, we probably are only about $.05 above the 2008 recession trigger level. Gasoline usage, at 8666 M gallons vs. 9349 M a year ago, was off a whopping -7.3%. The 4 week moving average is off -4.5%. For the last 2 weeks we have returned to the dramatically less usage YoY that started in March and intensified since July.
It is extremely difficult to reconcile these Dr. Jekyll and Mr. Hyde reports. Are we still on the rebound, or on the immediate cusp of a recession as ECRI has insisted? I am inclined to believe that, whether or not there is an actual recession, 1Q 2012 is likely to be the epicenter of weakness, not least because it is 12 months after the large spike in gasoline prices - and thus the point of maximum impact on the economy. But global weakness should mean lower gas prices, and recharged batteries for American consumers and businesses.
Friday, December 16, 2011
No -- REALLY -- Austerity is a VERY BAD IDEA
From the WSJ:
Note a central reason for the contraction -- a decline in government investment. To argue that government spending does not help the economy -- or is not part of the economy -- is so incredibly counter-factual as to defy basic logic.
DUBLIN—Ireland's economy contracted in the third quarter due to a sharp fall in business and government investment spending as a harsh austerity program kept domestic demand depressed and unemployment high
.
The Central Statistics Office Friday said gross domestic product in the three months through September was 1.9% lower than in the second quarter and 0.1% lower than in the same period of 2010.
Note a central reason for the contraction -- a decline in government investment. To argue that government spending does not help the economy -- or is not part of the economy -- is so incredibly counter-factual as to defy basic logic.
1950s GDP
The above chart is total GDP adjusted for 2005 dollars. One of the problems with using chained numbers far away from the data (such as using 2005 dollars for 1950s figures) is you can get somewhat distorted data. But it would be too severe -- plus, it's all we've got to work with.
First, note there were two recessions -- one from mid-1953- mid 1954 and a second from mid-1957- mid-1958. Two, evenly spaced recessions over a decade is certainly different from our current experience.
Eyeballing the chart, total, inflation adjusted GDP increased from a little over $1.9 trillion to a little under $2.8 trillion -- or an increase of about 47%. That is very impressive. But, remember, the US was a smaller economy back then. There was a tremendous amount of pent-up demand and we were the only game in town -- Japan and Europe were still recovering from WWII, so we produced most of what we consumed by default and provided most of the goods to the rest of the world.
The above chart is the compounded annual rate of change of GDP. Notice the very strong rates of growth in the early parts of the decade. Remember the Korean War lasted from 25 June 1950 – 27 July 1953, so the 1951 figures include the country getting its war facilities up and running. This explains the very strong growth rates in the early part of the decade. However, there were two other periods -- the first clustered around 1955 and the second around 1959 - when the compounded annual rate of change was over 5%.
Looking at the first half of the decade, we see very strong growth rates 5%+ fort eh first 7 quarters. followed by four quarters of slower growth from 4Q51-3Q52. There is another burst of three quarters of strong growth and then a recession from July 1953-May 1954. However, the economy bounced from that lull in late 1954.
The economy grow strongly in the mid-50s, but slowed down in 1956-1957. Notice there were three quarters of shallow contraction in 1956 and 1957. In August 1957, the second recession of the 1950s started which lasted until April 1958. This was followed by four quarters of incredibly strong growth.
What stands out here is that the economy vacillated from strong growth to recession fairly quickly. Also note there were two quarters of extreme contraction -- the first quarter of 1953 and the first quarter of 1958.
Announcing the Bonddad Economic History Project
Market charts will be back on Monday after I've gotten a new quote service lined up for Quotetracker
Or, better titled, what really happened in US economic history after WWII and beyond?
About three years ago, NDD and I wrote a series of articles on the Great Depression. Every time I see the revisionists bring out their New Deal agenda, I wind up referring to those articles because they more or less debunk all the revisionist crap out there. But, I wouldn't know that if I and NDD hadn't gone back to look at the actual data as presented by the various government agencies that keep track of the numbers.
Earlier this week, we had the standard revisionist garbage paraded out again -- sans data -- so I again felt the need to debunk their arguments. But that got me thinking -- how much do I know about the post WWII economy? The answer is not much, if anything. Then I started to dig around various economic websites to see what data is actually out there, and it turns out the answer is quite a lot. Going back to 1950, there's data on GDP, prices, M1's currency component, M2's currency/time deposits, a ton of loan data, industrial production and a great deal of employment information. Plus, there's plenty of anecdotal information in the President's report of the Economy and various Federal Reserve reports. So, in short, there's more than enough material to work with.
What's the point of all this? To figure out what really happened in the US economy since WWII -- because I really don't know as much as I would like to know about the U.S. economy.
This is a very wonky project; I don't think it's going to be a huge driver of traffic. But that's not the point.
Also, this will be sporadic, depending on my work schedule. For reasons unknown, this stuff relaxes me. I have no idea why.
Anyway, I'll be starting with the 1950s and working my way through the history. This will be a slow and deliberate process. But, it will be thorough.
Or, better titled, what really happened in US economic history after WWII and beyond?
About three years ago, NDD and I wrote a series of articles on the Great Depression. Every time I see the revisionists bring out their New Deal agenda, I wind up referring to those articles because they more or less debunk all the revisionist crap out there. But, I wouldn't know that if I and NDD hadn't gone back to look at the actual data as presented by the various government agencies that keep track of the numbers.
Earlier this week, we had the standard revisionist garbage paraded out again -- sans data -- so I again felt the need to debunk their arguments. But that got me thinking -- how much do I know about the post WWII economy? The answer is not much, if anything. Then I started to dig around various economic websites to see what data is actually out there, and it turns out the answer is quite a lot. Going back to 1950, there's data on GDP, prices, M1's currency component, M2's currency/time deposits, a ton of loan data, industrial production and a great deal of employment information. Plus, there's plenty of anecdotal information in the President's report of the Economy and various Federal Reserve reports. So, in short, there's more than enough material to work with.
What's the point of all this? To figure out what really happened in the US economy since WWII -- because I really don't know as much as I would like to know about the U.S. economy.
This is a very wonky project; I don't think it's going to be a huge driver of traffic. But that's not the point.
Also, this will be sporadic, depending on my work schedule. For reasons unknown, this stuff relaxes me. I have no idea why.
Anyway, I'll be starting with the 1950s and working my way through the history. This will be a slow and deliberate process. But, it will be thorough.
Thursday, December 15, 2011
Bonddad Linkfest
- SNB will defend the 1.20 level
- EU region likely contracted in the fourth quarter
- German service sector expands
- Norway cuts rates 50 BP
- Japanese Tankan survey worse than expected
- Congress weighing the length of unemployment benefits
- What are Dr.s copper and gold saying?
- Is the government lying about the economy?
- Grains drop due to strong dollar
- Why small delays on climate change can be costly
ALWAYS bet against the Pied Piper of Doom
- by New Deal democrat
The Pied Piper of Doom, November 17, 2010:
The Pied Piper of Doom, January 21, 2011:
Here's a graph of the municipal bond index since the date of the first diary quoted above, 13 months ago:

In case you didn't already notice, the three false prophecies by the Pied Piper of Doom almost exactly coincide with the bottom of the three V's at the bottom left of the graph.
The Pied Piper of Doom, November 17, 2010:
It appears that--based upon the ongoing analysis of reports on two economy-related stories that started to develop late on Tuesday--the shit may, indeed, be hitting the fan concerning late-breaking news and commentary on ... the truly dire straits of the finances of at least some of our country's states and municipalities.The Pied Piper of Doom, December 5, 2010:
Over in municipal- and state-default land, a (very) highly-respected stock market analyst, Institutional Risk Analytics' Chris Whalen, has made public pronouncements that California will default on its debt.
In Sunday's NY Times' lead, Michael Cooper and Mary Williams Walsh talk of an ongoing, massive collapse in state and municipal budgets around the country.NOTE: In case you don't recall, in December 2010 Meredith Whitney predicted "between 50 and 100 'significant' municipal bond defaults in 2011, totaling 'hundreds of billions' of dollars."
...Some of the same people who warned of the looming subprime crisis two years ago are ringing alarm bells again. Their message: Not just small towns or dying Rust Belt cities, but also large states like Illinois and California are increasingly at risk...The journalists focus upon commentary from Wall Street analyst Meredith Whitney, someone who's gained a well-earned reputation (she's also one of my favorites) for prescience due to the fact that she was one of the first to warn us of a mortgage meltdown. She now "...sees similar problems with state and local government finances."
The Pied Piper of Doom, January 21, 2011:
Up until now, the concept of states filing bankruptcy has been a moot point. According to various legal precedents, basic definitions of sovereign law, and the U.S. Constitution, it simply couldn't happen. Up until now...Bloomberg business news, December 15, 2011:
...I can already read the diary comments in coming months where the DKos audience is told how Main Street will benefit from state bankruptcies...and, of how many jobs this will save.
....The real question, IMHO, is this: Since when did Bank of America and Citigroup become more important to our nation than California, Illinois and New York?
Refuting Whitney’s forecast, which helped send borrowing costs to two-year highs in January, the $3.7 trillion municipal- bond market rebounded this year, generating an average total return of 10 percent through Dec. 12, better than U.S. Treasuries and corporate bonds, Bank of America Merrill Lynch indexes show. Munis also trounced equities as the Standard & Poor’s 500 Index lost (SPX) 0.6 percent in the same period.(my emphasis)
Here's a graph of the municipal bond index since the date of the first diary quoted above, 13 months ago:

In case you didn't already notice, the three false prophecies by the Pied Piper of Doom almost exactly coincide with the bottom of the three V's at the bottom left of the graph.
Subscribe to:
Posts (Atom)