- by New Deal democrat
Last week the Philadelphia Fed published a working paper suggesting that in the second quarter of this year only 10,500 jobs were actually added, rather than the 1,047,000 as indicated by the monthly Establishment survey.
Here’s their graph:

Here’s what you need to know about the QCEW (Quarterly Census of Employment and Wages):
The late Jeff Miller, a portfolio manager who was extremely popular at Seeking Alpha, and was previously a college professor who taught public policy courses and quantitative methodology at the University of Wisconsin-Madison and Lawrence University, had this to say:
“ Each quarter the BLS reports data from state employment agencies. Since no one pays insurance premiums on phantom employees, we can expect conservative information. The only problem is that it takes about nine months to get these actual counts.
“Any honest observer of the market would circle the date of this release….”
The QCEW is generated by more than 95% of all employers, essentially all who pay unemployment insurance; versus the monthly Establishment survey, which is generated by a sample of 650,000 employers.
In order to understand how the Philadelphia Fed arrived at its result, I have gone back and crunched the numbers for Q2 job growth (or losses) in the QCEW since the beginning of the database in 2001. In the below chart, the first line is the year, the 2nd is the non-seasonally adjusted number of jobs added in Q2 in the QCEW, in millions, and the 3rd is the non-seasonally adjusted Establishment survey number:
Year QCEW PAYEMS
2001 2.0* 1.622002 2.5 1.79
2003 2.4 1.74
2004 2.9 2.76
2005 3.0 2.81
2006 2.9 2.58
2007 2.7 2.43
2008 1.9* 1.55
2009 0.7* 0.14
2010 3.1 2.61
2011 2.7 2.71
2012 2.7 2.46
2013 2.8 2.61
2014 3.2 2.83
2015 3.2 2.75
2016 2.7 2.62
2017 2.9 2.58
2018 2.9 2.70
2019 2.6 2.44
2020 -12.0* -16.3
2021 3.6 3.25**
2022 2.1 2.91
*=lower than Q2 2022 QCEW
**=higher than Q2 2022 CES
**=higher than Q2 2022 CES
I then went back and compared with the seasonally adjusted Q2 numbers in the CES. Every year that the NSA QCEW numbers for Q2 were below 2.0 showed actual job losses in the seasonally adjusted CES. The three years with the next higher numbers compared with Q2 2022 - 2007, 2012, and 2019 - generated seasonally adjusted CES job gains of 90,000/month, 85,000, and 165,000.
So at this point it very much looks like the Philadelphia Fed’s paper has a lot of merit: the NSA QCEW data shows a very serious slowdown in job growth in Q2. And since the QCEW isn’t a survey sample, but rather collects about 95% of the entire data, it needs to be taken seriously (with the caveat that it is preliminary data).
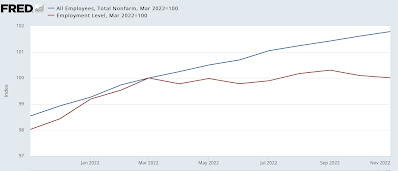
It’s also in accord with the Household survey, which shows only 12,000 jobs added since March:

and payroll tax collections by the US Treasury, which show a sharp slowdown that is first apparent in June’s +0.5% YoY growth. Here’s my recapitulation of YoY payroll tax payments to the US Treasury for each month of this year through November:
- January 2022/21: up +21.3%
- February 2022/21: up+11.6%
- March 2022/21: up +6.2%
- April 2022/21: up +11.5%
- May 2022/21: up+17.2%
- June 2022/21: up +0.5%
- July 2022/21: up +5.4%
- August 2022/21: up +10.2%
- September 2022/21: up +1.7%
- October 2022/21: up +12.2%
- November 2022/21: down -2.5%