- by New Deal democrat
Let’s take a more detailed look at last Friday’s November jobs report, in particular a discussion of the more leading sectors.
First, let’s update the three leading sectors of employment that I have been tracking: temporary help (blue in the graph below), manufacturing (gold), and residential construction (red). Here’s what they look like compared with 2018, showing the slowdown this year (Note: the big decline in manufacturing in October was the GM strike, which as expected was reversed in November):
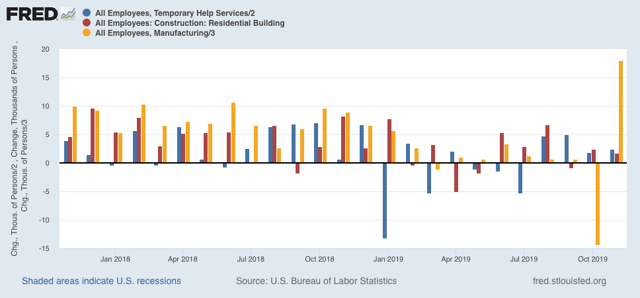
Residential construction looks like it has rebounded from its losses earlier this year, more confirmation of the rebound in the long leading housing sector.
As for temporary help, it continues to defy the gloomy weekly statistics that have been worsening this year in the American Staffing Association report. On the other hand, the pattern of downward revisions has persisted. This year there have been almost relentless downward revisions in that number. That pattern was mixed for September and October, as the downward revisions in the first were almost exactly matched by the upward first revision to the latter. Below are the original number for the last four months on the left, followed by the first and then final revisions to the right:
JUL +2200 -7300* -10,500
AUG +15,400 +14,500 +9,500
SEP +10,200 +20,100 +9,900
OCT -8100 +3800*
NOV +4800
*1st revision only
Next, the average manufacturing workweek remains down 0.9 hours per week YoY from its peak. Although I only show data from 1983 onward below, going back 70 years there have only been 2 occasions where such a decline lasted longer than one month without a recession happening (1953 and 1966). In the modern era shown, only in 1985 and 1995 for one month apiece were there 1 hour declines without a recession following. A look at the YoY% change in manufacturing hours for the past 35 years also shows that such losses have *always* led to actual YoY losses in manufacturing jobs:
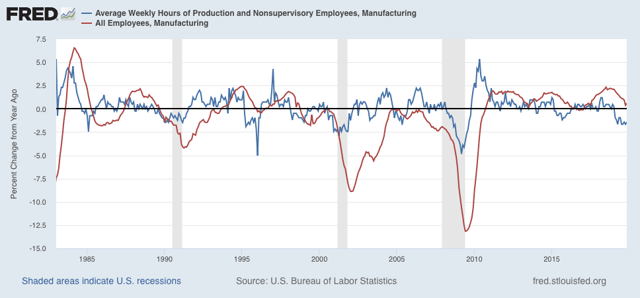
So, despite the rebound in November, we should expect more and significant actual losses in manufacturing jobs going forward. And, like temporary help, the revisions for manufacturing employment have all been downward for six of the past seven months:
APR +4. +3 (-1)
MAY +3 +2 (-1)
JUN +17 +10 (-7)
JUL +16 +4 (-12)
AUG +3 +2 (-1)
SEP -2 +2 (+4)
OCT -36 -43 (-7)*
NOV +54
*1st revision only
For the first 11 months of 2019, manufacturing has only added 34,000 jobs.
More broadly, since January of this year, only 97,000 jobs have been added in the entire goods-producing sector:
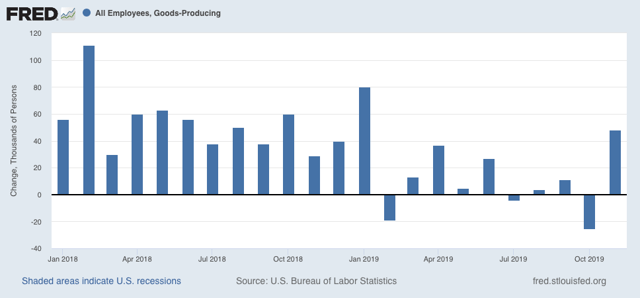
Further,there have been YoY losses in goods-producing jobs before all of the past 3 recessions, and going back 70 years, counting 12 recessions, in all but 3 there has been steep deceleration before and actual losses no later than two months into the recession, with only 2 false positives (1966 and 1985). This is consistent with at very least a severe slowdown.
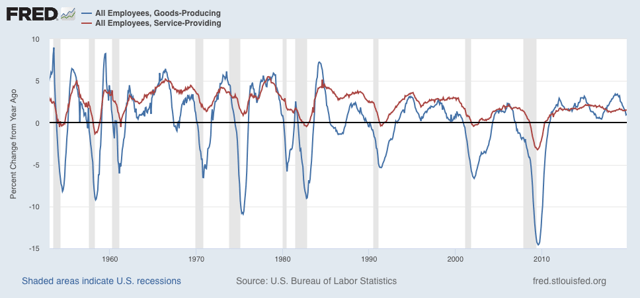
Where there has not been a slowdown is in the (non-leading) services sector, which remains at roughly 1.5% growth YoY:
To sum up with regard to the leading sectors, Friday’s report was indeed good, but given the revisions, not quite as good as it appeared at first blush.
Pointing to the ISM manufacturing slowdown, a slowdown in small firms’ hiring, the manufacturing workweek, and the narrowness of the 2015-16 slowdown, concluding “people ought to discuss the actual data instead of making baseless claims.”
So I thought I would go back and take a look at the actual 70 years of data.
Since Friday’s report showed a m/m gain of 0.175%, I made a two graphs together showing the m/m% gain for the last 80 years, from which I subtracted -0.175%, so that any showing equal to November’s would be at the zero line, and only those showings better than November would be positive.
Here’s what I got:
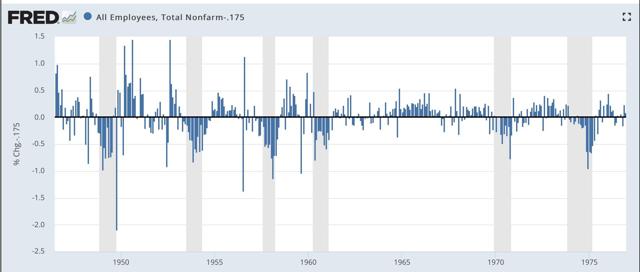
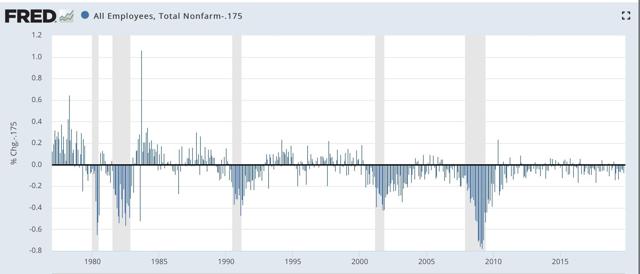
The two time periods are significantly different. During the post-war boom through 1974, it wasn’t uncommon at all to have readings equal to or better than November’s right before a recession began. In fact it happened just prior to every recession except for 1955 and 1957. Since 1974, though, it is a different story. Only in 1981, when the Fed raised rates sharply, was there a reading as good as November’s within 3 months of the onset of a recession. Prior to the last two recessions the lag was much, much greater. In either time frame, the three month rolling average was less than 0.175%/month leading up to recession - but of course it is now as well.
So, credit to Mish for raising a fair point. But I think the data from the modern era, where manufacturing is much less a component of the jobs picture is the most applicable. So I still think the November report is strong evidence against a recession before February.