- by New Deal democrat
[Note: I’ve been working on my “what leads consumer spending” opus, and as often happens, I don’t want to publish anything until I’m sure I’ve got something good - which means lots more research and saved graphs — and nothing whatsoever published! I owe you something for today, so here’s a little nugget ....]
If you want a “quick and dirty” forecast for the economy over the next 4 to 6 months, the easiest approach is to look at stocks (vis the S&P 500 index) and initial jobless claims.
I’ve been noting for awhile that initial claims have gone basically nowhere since February 2018, and this afternoon I was reminded that it was the case for stocks as well. Here’s both (claims are inverted, red). Both are normed to 100 as of the week they started to go sideways:
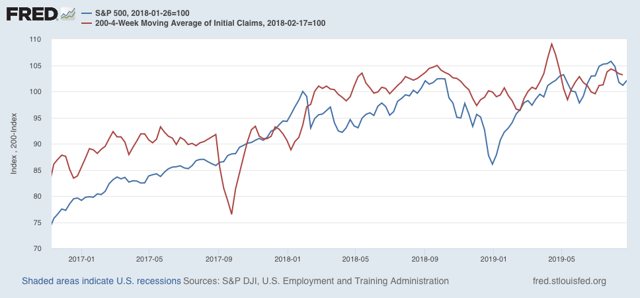
Both were strongly positive in 2017. But for the last 18-19 months, both have with rare exception oscillated within 5% of that initial point, with the *slightest* of positive trends. Both continue to absolutely shout “SLOWDOWN” but neither points to recession in the immediate future.