- by New Deal democrat
I have started to monitor initial jobless claims to see if there are any signs of stress.
My two thresholds are:
1. If the four week average on claims is more than 10% above its expansion low.
2. If the YoY% change in the monthly average turns higher.
Here’s this week’s update. [NOTE: I’ll add the relevant graphs later.] UPDATE: graphs added.
My two thresholds are:
1. If the four week average on claims is more than 10% above its expansion low.
2. If the YoY% change in the monthly average turns higher.
Here’s this week’s update. [NOTE: I’ll add the relevant graphs later.] UPDATE: graphs added.
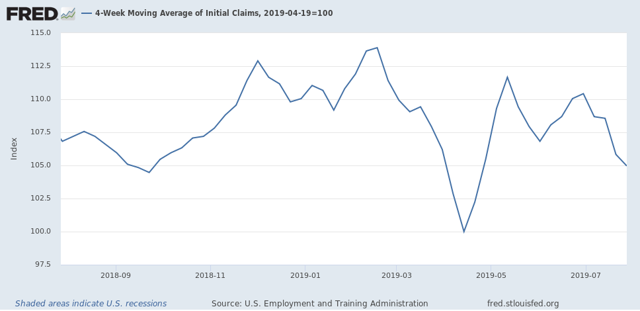
Initial jobless claims last week were 215,000. This is in the lower part of its range for the past 18 months. As of this week, the four week average is 5.0% above its recent low:

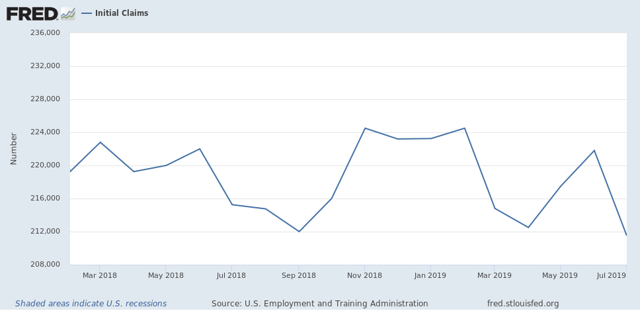
Last July, initial claims averaged 215,250. Thus the monthly YoY comparison, at 211,500, or -2.7% lower, and so also remains positive:

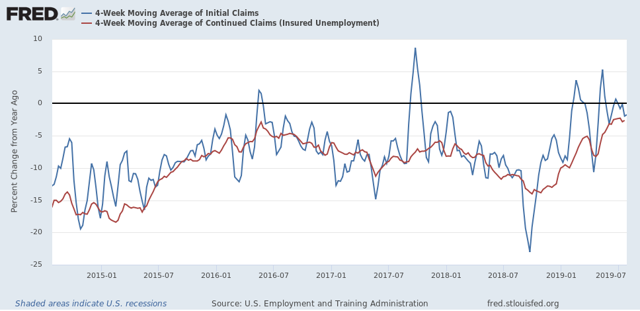
Finally, let’s compare the YoY% change in initial claims (blue) with continuing claims (red):

Comparisons have been getting closer to crossing the threshold from lower to higher, but for the past several weeks have trended a little lower, which is more positive. This. week the comparison was -2.7% YoY. So far - this is most consistent with the 1984, 1994, and 1996 slowdowns, and not a recession.