- by New Deal democrat
Naked Capitalism picked up a piece from Wolf Richter the other day (subsequently copied-and-pasted by the Pied Piper of Doom) entitled, The shrinking piece of a barely growing economy: why the Glorious Economy of ours feels so crummy. It's ultimate conclusion is,
Since PCE is used to adjust GDP for inflation, “real” economic growth has been systematically overstated by understating inflation. If GDP had been deflated over the years with CPI, instead of PCE, that measly 2.3% growth of per-capita GDP since 2007, as crummy as it may appear, would likely benegative. And that explains why so many people – struggling with soaring rents, medical expenses, college costs, etc. – find that their slice of the economic pie has been shrinking since the financial crisis.
Is the economy actually "shrinking?" Do consumers really think it's "crummy?" Although the facts do not support either of these assertions, as we will see the benefits have skewed towards those whose incomes normally are associated with GOP voters.
The first clue that this is a cherry-picking Doomer piece is the use of the present progressive tense, to convey the sense of an ongoing trend, and the selection of a specific starting point. Now, there are good reasons not to use GPI as the GDP deflater, since GDP measures a lot more than consumer activity, even though it is the largest component, but let's pass that. Richter's claim that if GDP were deflated by CPI, "would likely be negative" since 2007, is easy to examine. It took be about 3 minutes to generate the graph at the St. Louis FRED. And technically, if we simply compare Q3 2014 to Q3 2007 in that graph, indeed Q3 is 0.3% lower than the 2007 peak.
Which make me wonder why he didn't do it. Probably because when you graph real per capita GDP deflated by PCE (red) and compare it with real per capita GDP deflated by CPI (blue), and put it in the context of a longer term (here, 20 years), this is what you get:

Does this look like an economy that is "shrinking" to you? Whichever way we measure, the economy per capita shrank (past tense) by 5% or 6% in 2008 and 2009, and has grown by about 6% to 7% since then, over 5 years. Since 2010, with the exception of 3 quarters in 2011, real per capita GDP has grown at a similar rate regardless of whether DPI or PCE is used as the deflator:

Not only that, but real per capita disposable income has made a new high as well:
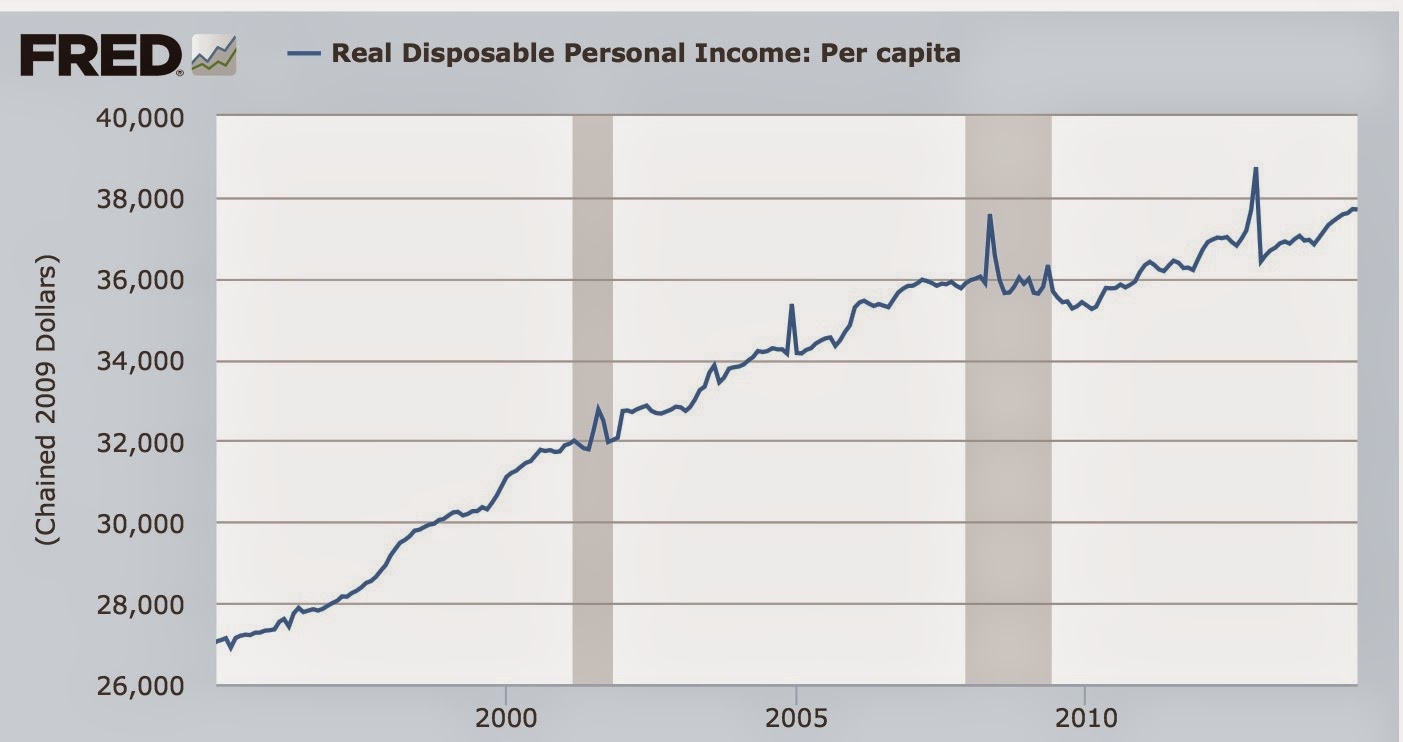
So, if I were happy with GDP in 2007, why wouldn't I also be happy now, if on a per capita basis, it is less than 0.3% from the peak quarter of that year?
Assuming that is true, then the answer, presumably, is that the benefits of the expanding economy for the last 5 years have by no means been evenly shared, something Richter mentions in only one sentence, with no data in support.
This is also easy to examine. Here's a graph of the labor share of GDP. This has sunk like a stone since the turn of the Millennium, before stabilizing at a very low level in the last 4 years:

Now let's deflate real GDP per capita by this labor share, and see how the average worker is experiencing GDP:

Since the labor share has not significantly improved after plummeting in the recession, the average worker, unlike GDP as a whole, has not returned to their level of financial well-being in 2007 - although even for them the situation has improved significantly since the bottom.
Here's an alternate way of looking at the same thing. This is average hourly wages, deflated by the CPI, and deflated further by the unemployment rate. This gives us a good measure of the average income received those who are working plus those who want to work, but haven't found a job:

Note that after flatlining pretty much since the Millennium, it has turned up in the last 18 months or so.
And that's what consumers are telling the pollsters. Here's the Conference Board's consumer confidence measure:
And here's the similar measure by the Univesity of Michigan:

Note that the present conditions index for each, while not all the way back, is close to where it was in the last expansion. And here's a look at Gallup's economic confidence index as well, first over the longer term:

And now for the last year:

Note the improvement here as well.
And remember this graph, when Pew Research recently asked people if they though the economy was recovering:
And remember this graph, when Pew Research recently asked people if they though the economy was recovering:

All of these measures are similar to what we saw above when we looked at the hard economic data.
So, on the whole, consumers don't think the economy is "crummy," either. More like "meh," neither particularly good nor particularly bad.
But here is the most telling and interesting breakout of that confidence, from Bespoke Investment via Cam Hui, comparing confidence among those earning more than the median (red), and $30,000 - $50,000 (blue):

Note the big difference - in fact, the biggest divergence in the history of the series. The choice of colors is appropriate. The more affluent tend to be Republican, the less so, Democrat. Affluent Republican voters - who usually have higher turnout anyway - appear to be reasonably satisfied with the economy, and thus likely to support GOP incumbents. Democratic leaning members of the working class are still as pessimistic as they were 10 and 20 years ago - with no compelling reason to reward Democratic candidates, who haven't been touting any program to deal with the ongoing malaise.