- by New Deal democrat
As you know, since the expansion in jobs is firmly in place, recently I have turned my attention to metrics of underemployment and wages.
We're having the best year for jobs added in over a decade. Jobs have grown by almost 2% in the last 12 months. This is about 1% over population growth and should get us to full employment in about two years, if the trend continues.
Let's look at a few measures of labor underutilization beyond the unemployment rate.
First, here is the employment to population ratio for ages 25-54, Prof. Krugman's favorite shorthand measure:

This made a new post-recession high in the latest report. It is 2.1% off its bottom and is 2.9% off 79.5%, a reasonable figure for full employment.
Next, here is involuntary part time employment as a share of the civilian labor force:

This is about 1.5% higher than during full employment years. Note it is also following a trajectory similar to that following the severe 1982 recession.
Next, here is the number of those who aren't even counted in the civilian labor force but want a job now:

This one is bad news. It has been moving in the wrong direction ever since Congress cut off extended unemployment benefits at the end of last year, and is back close to 2 million above where it should be for full employment.
Finally, here is a look at wage growth for nonsupervisory personnel (blue) vs. consumer inflation (red):
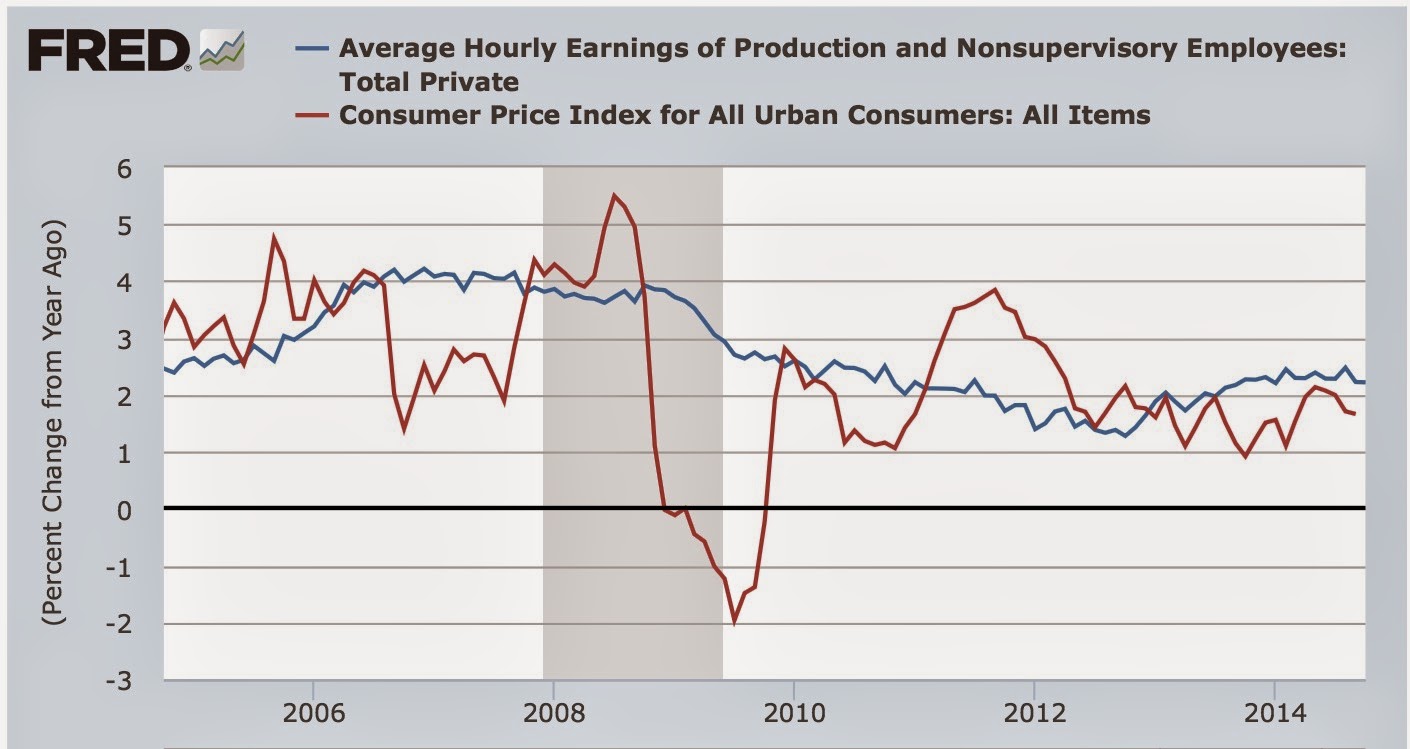
This is a little bit concerning, because nominal wage growth, now +2.2% YoY, has gone in the wrong direction in the last couple of months. On the other hand, real wages have grown, because consumer inflation has declined (thank you, gasoline!). I do expect both the nominal and inflation adjusted numbers to improve in the coming months. We'll see. The bottom line for now is, real wages have improved slightly, but over the longer term remain stagnant.