- by New Deal democrat
As you all know, based on 60 years of history, almost always when interest rates have moved up 1%, housing permits at some point soon thereafter have been -100,000 lower YoY.
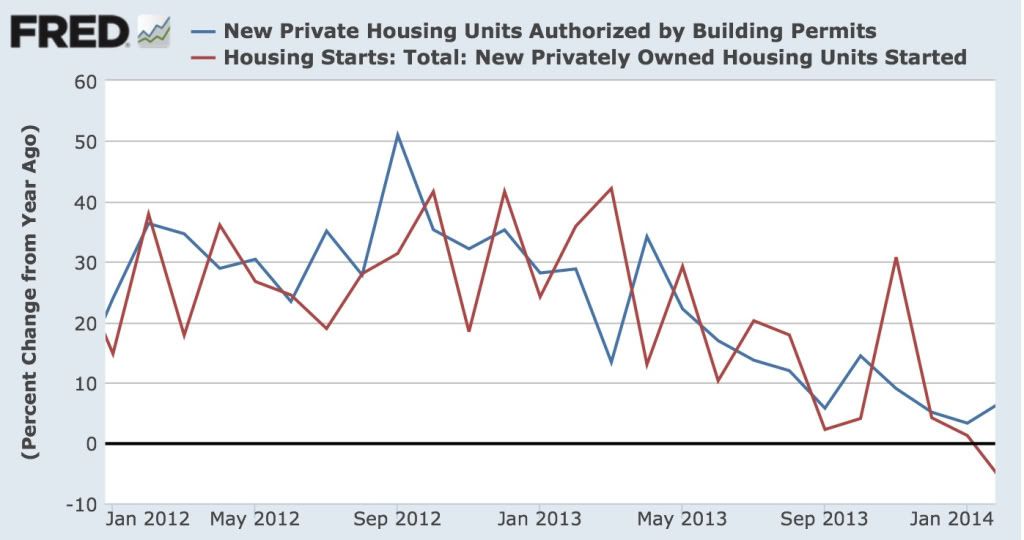
This morning permits rose 63,000 from January to 1.012 million, for a YoY 6.3% increase. Starts fell -2,000 to 907,000 from January, but are -62,000 less than they were a year ago, or -6.4% YoY. Here's the graph, starting from January 2012, of the YoY% changes in permits and starts:
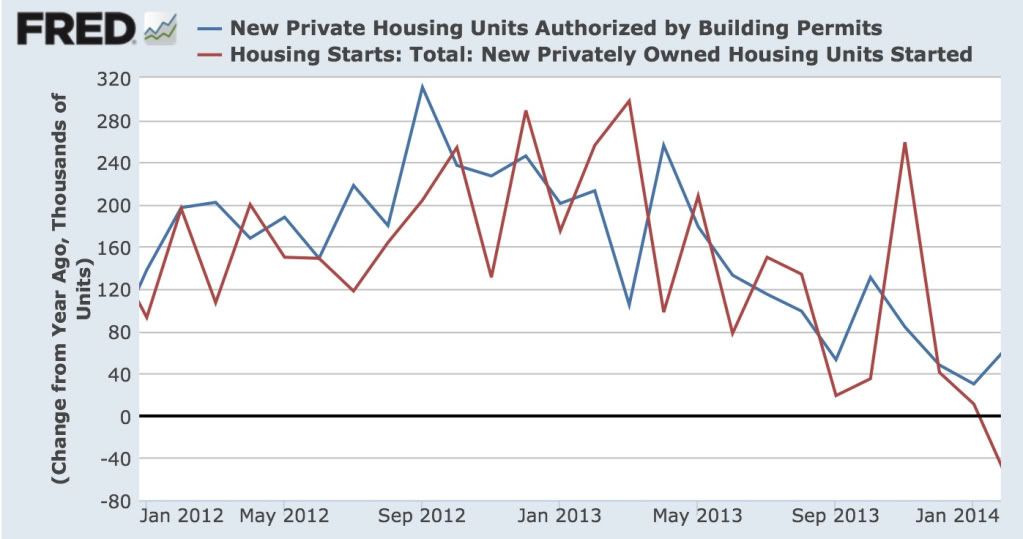
Here is the same information, represented by 100,000s of units:
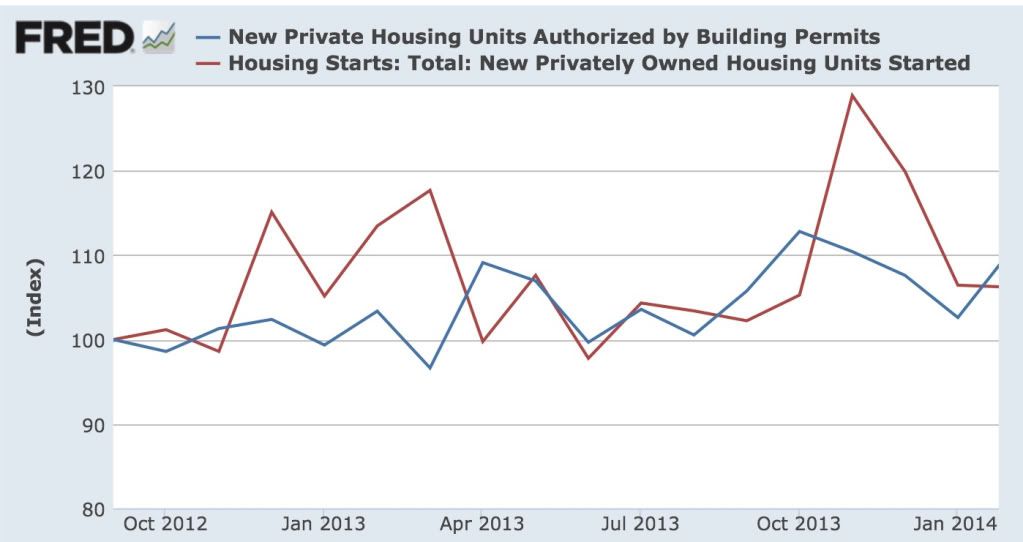
Finally, here are both permits and starts, normed to 100 as of September 2012 (when the decelerating trend began):
At first blush, it looks like the decelerating trend in housing has continued (granting that permits are at the top of their trend channel), and in the case of starts, we have had an outright YoY decline. While we haven't hit my -100,000 target, I wonder how many people thought there would be a -62,000 YoY decline a few months ago when I first made my forecast?