- by New deal democrat
With yesterday morning's surprise -50,000 month/month decline in new home sales, the 2013 housing data is in the books, and it confirms that in 2013 there was a marked slowdown in the housing recovery.
Below is the graph of building permits (blue), starts (green), new home sales (beige) and existing home sales (orange) for the last three years, normed to 100 at the start of each year:
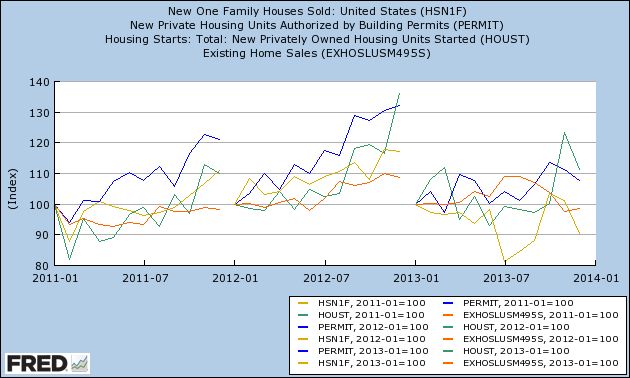
After being up over 10% in each of 2011 and 2012 (over 20% as to permits), permits, starts, and new home sales finished 2013 up 10% or less for the year, and existing home sales are actually negative for the year.
Now here is the same data presented as YoY percentage change, and compared with the YoY change in interest rates (red, inverted, right scale):
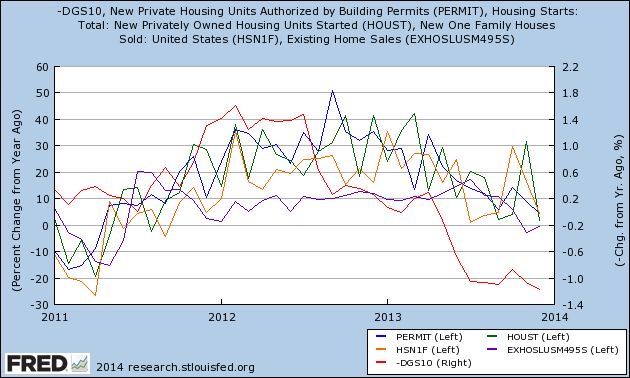
The simple fact is that the housing market follows interest rates usually with a six to nine month lag.
Finally, here are housing permits (blue) and starts (green) in 100,000's YoY vs. interest rates, inverted:
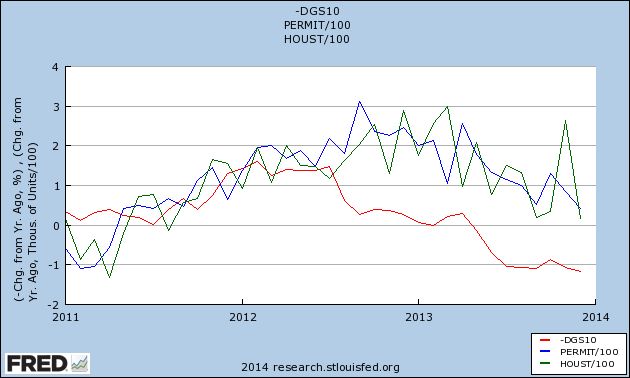
The past history is that a 1% increase in interest rates typically is consistent with a 100,000 decline in permits and starts. The data that we have seen in December confirms that in 2013 we already have seen a slowdown, and is in accord with my forecast that at some point this year, we will see a YoY change of -100,000 in permits and/or starts. Could it be different this time? Of course, but history is on my side.