- by New Deal democrat
I normally don't bother with Doomers any more. They've demonstrated for 4 consecutive years that they've been wrong about just about everything. So yesterday I was minding my own business earning a living when Bonddad let me know that he had written a response to a "ZOMG We're in another housing bubble and we're DOOOOOMED!!!" piece. I took a look and ran down their links and past pieces, and sure enough, last year they were writing that the housing market wasn't recovering at all. Now that we have over 1 million housing permits annualized being reported, and prices being up 10% YoY, suddenly they are stomping their feet at wailing that it simply must mean there is a housing bubble.
The critical graph in the article is this one, which comes from (of course) Zero Hedge:
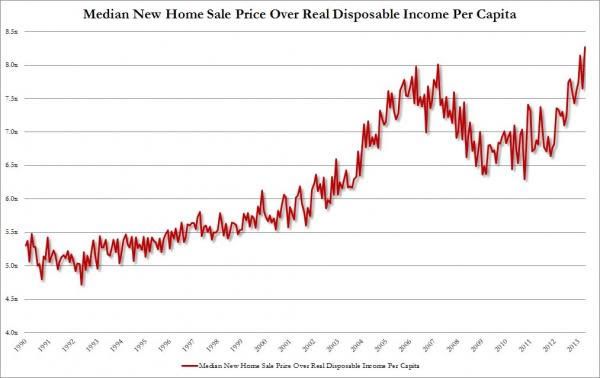
The graph purports to show that housing prices are as out of whack as they were at the top of the housing bubble.
There's just one little problem with the graph: it is intellectually dishonest. It compares nominal house prices with inflation adjusted disposable income. To do a real comparison you need to compare nominal prices with nominal income, or inflation adjusted prices with inflation adjusted income.
Let me give an example. Suppose in a given number of years a dozen apples increased in price from $1 to $5. Meanwhile wages went up from $1 to $10, and inflation went from $1 to $7.50. Whether I compare in nominal or real terms, in my example wages went up twice as much as apples. But if I adjust wages for inflation, wages only went up from $1 to $1.33, while apples nominally went up from $1 to $5. Horrors! But intellectually dishonest. And that's exactly what Zero Hedge's graph does.
I'll go to the graphs to show you what the real story is in a moment, but let me also note a second important problem with the Zero Hedge graph. The graph shows prices from the Census Bureau's monthly report of median prices of new single family homes. Note two things: this does not include multifamily dwellings, and it does not include sales of existing homes.
The number of new homes sold in any period of time is much, much smaller than that for existing homes. For example, in April 2013, the last month reported, new single family homes were sold at a rate of 454,000 a year. But existing home sales as reported by the NAR came in at a rate of 4,970,000 a year, or more than 10 times that of new homes! Literally the entire "housing bubble" is actually claimed to be in less than 10% of the market!
So now let's see what is really happening. In this first graph, I have shown the median price for new houses in blue, and the Case Shiller Housing Index which includes existing home sales in red, both normed to 100 in 1987. Both of these are nominal prices:
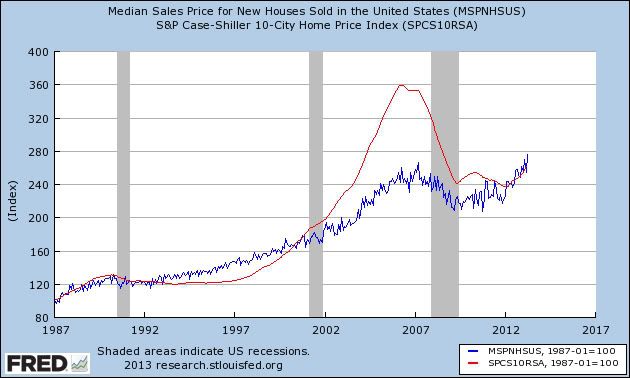
Note that existing homes were in a much bigger bubble than new single family homes, and fell much further during the bust.
Next, let's adjust each for inflation, using the consumer price index:

The relationship between the two series is the same, but note that, for example real prices for existing homes doubled in real terms rather than going up 3.6x in nominal terms.
Now let's add a line (green) showing real disposable personal income, also normed to 100 in 1987:
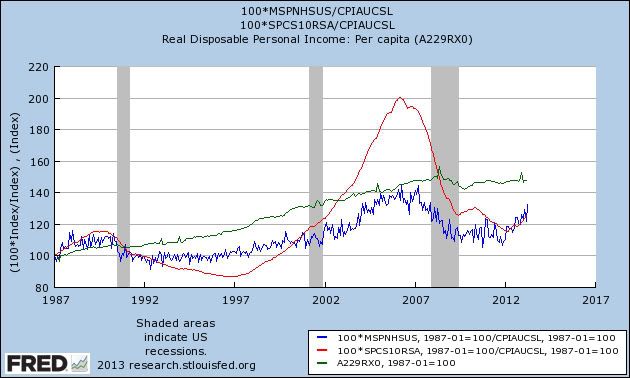
Note that real disposable personal income actually increased more than either real existing home prices or new home prices at all times except briefly during the late 1980's and again during the bubble in existing home prices.
So now let's make the intellectually honest graphs. First, here's the graphcomparing real new home prices divided by real disposable pesonal income (blue) and real existing home prices divided by real disposable personal income (red):
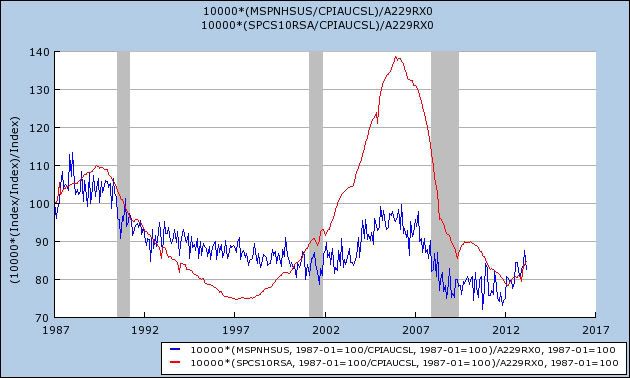
And finally,just so you don't think I'm pulling a stunt with the inflation adjustment, here's a graph of the same thing using nominal prices and income without any Inflation adjustment:
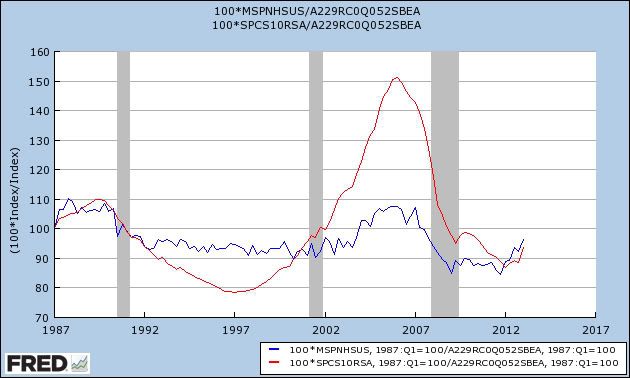
Do those little upturns beginning in 2012 look like a bubble to you? If not, we're not in a new housing bubble and Zero Hedge and their acolyte Doomers are wrong < sigh > Again.