Monday, July 9, 2012
Morning Market Analysis
The 5-minute QQQ chart shows an opening gap lower in Friday caused by the payrolls report. Prices continued to move lower until noon when prices stabilized. Prices moved sideways until 2:30 when we saw a small rally begin.
The 30 minute charts shows that prices were moving higher all last week until the payrolls report sent the market lower on Friday.
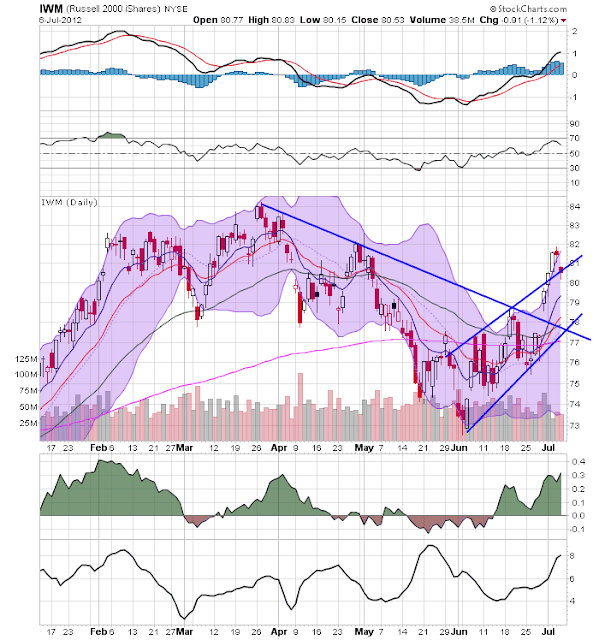
The chart of the three major averages is actually moderately encouraging. The IWMS spiked last week, before falling lower on Friday. However, as this is the risk based market, the upward move indicates traders may be looking at accepting a bit more risk in their portfolios. The QQQs and SPYs are also moving higher, although they are each doing so in a far more disciplined manner. The good news in these charts is the move higher, albeit at an incremental pace. I think the best description for the latest move is "grinding."
Last week I noted that the treasury yield curve was still rallying across maturities, indicating that the safety bid was still in play. The above charts of the corporate bond market show the exact same scenario: across the maturity spectrum, prices are still rallying, telling us traders/investors are reaching for safety.
The oil market rallied in response to the EU's financial announcement at the end of the preceding week. Prices continued their rally until they hit the 50 day EMA on Thursday. This was followed by the weak US employment report on Friday, which told traders that the world's largest oil consumer was still mired in weak growth. As a result, prices dropped to the 10 and 20 day EMA price levels.
After rallying in response to the EU situation in early May, The dollar has traded in a sideways pattern, moving between 22.4 and 23. The shorter EMAs tell us that prices have little momentum going forward.


