Wednesday, October 24, 2012
Morning Market Analysis
While a lot was discussed about yesterday's sell-off, the real issue is that prices gapped lower at the open and then traded sideways for the remainder of the trading session. While there was a big sell-off at the end, prices did not close at their session lows.
The 30-minure (top chart) and 60 minute chart (bottom chart) show that the 142.5 level was a key support level for both charts. Prices moved through this level yesterday at the open and remained at that level for the remainder of the session.
On the daily chart we see several important technical developments. First, the 142.5 price level noted above was a key on the daily chart's consolidation pattern. Prices moved through that level and are now at a key Fib fan level. Second, notice the increase in volume over the last few trading sessions, indicating that overall traffic is picking up. The MACD is moving lower, prices are weakening, and the CMF is negative. All of this points the possibility of a prolonged correction.
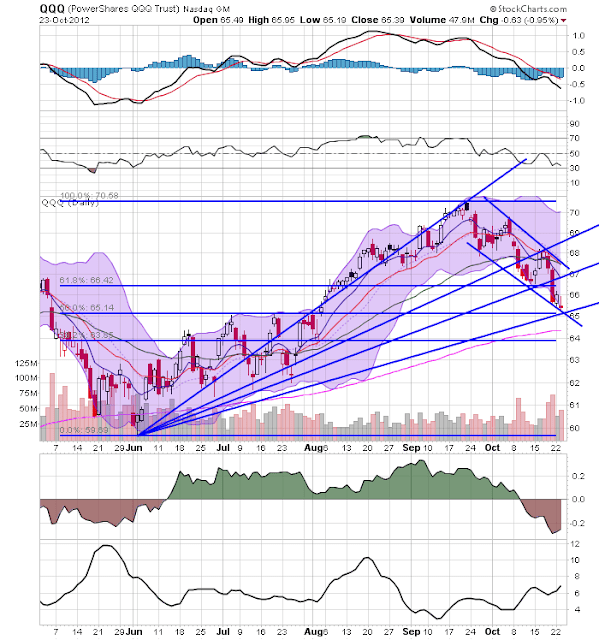
The IWMs and QQQs are both in a net selling position as well. However, notice that neither printed a strong, downward sloping candle yesterday. Instead, the IWMs (top chart) printed a hanging man and the QQQs (bottom chart) printed a reverse hanging man.


