
The daily chart of the Australian dollar shows that it has been consolidating between the 102 and 106 level for the last two months. But last week the central bank lowered interest rates. We've also seen reports issued about the potential for slowing global growth, especially for commodity exporters. Hence, we now see prices resting right at the 200 day EMA.
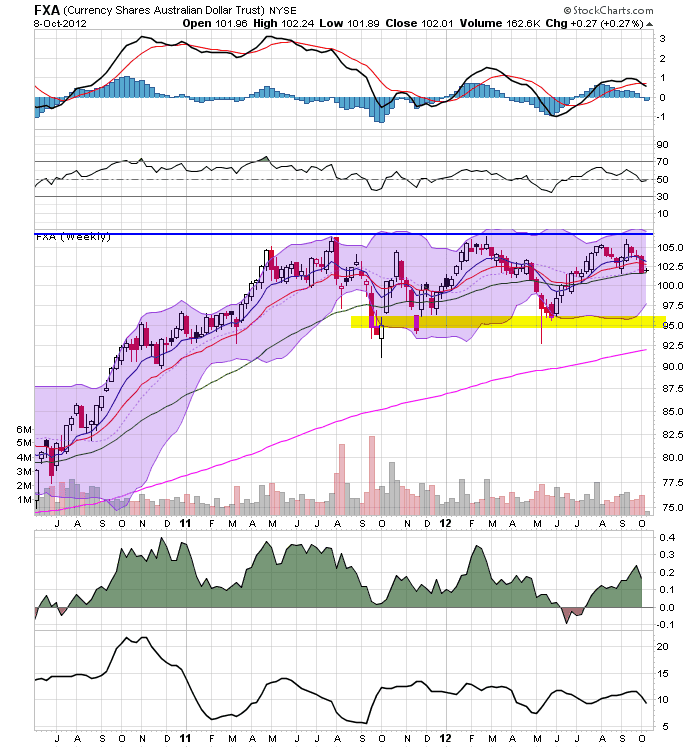
On the weekly chart, the Australian dollar has support at the 95 price level.

The daily SPY chart shows prices are sill in an uptrend, but they have consolidated in a rectangle consolidation pattern over the last month. We see support around 143 and resistance around 146. Overall, this looks like a standard consolidation after a rally.

The QQQs have broken their upward sloping trendline and have support around the 68 price level. However, also note the 50 day EMA -- which provides key support for this chart. The declining MACD indicates we'll probably see a test of this level soon.


Finally, we have two other charts of broad markets -- the mortgage back market (top chart) and the municipal market (bottom chart). Despite the trend break we saw in the US treasury market yesterday, these two markets are still rallying. This tells us that there is still a strong bid for bonds out there.