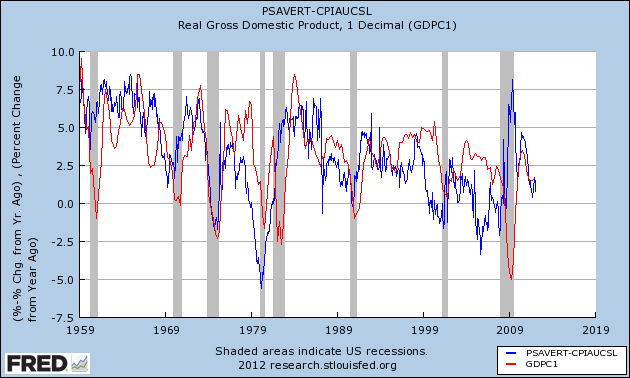
Henry Ford famously said that he wanted to pay his workers enough so that they could afford his cars. The wisdom of that statement, I submit, is borne out by the graph of the real personal savings rate I posted this morning. Here it is again:

The point is that the real personal savings rate leads GDP by 1 to 2 years, and has consistently since World War 2. Although not shown above, consumer savings skyrocketed after the nadir of the Depression in 1933, and continued through World War 2. When the GI's came home, there was an enormous pool of savings set to power the post-War boom. Notice, however, that the real personal savings rate has generally declined since the 1960s. After briefly recovering in the early 1980s, the almost inexorable trend since has been downward -- and the trend of declining peaks in GDP has followed.
With the "Great Recession" the savings rate again briefly surged. GDP rose, but not nearly so much, as households focused on refinancing debt at lower interest rates, paying it down, paying it off, or simply defaulting. The result has been that households in the aggregate are in their best shape in 30 years to begin both saving and spending more, as shown in this graph of household debt levels I have been updating every quarter for several years. It is only current through December 2011. The next update, covering the first quarter already ended, will come in June:
Lakshman Achuthan of ECRI has said for several years that we are in a pattern of more frequent and deeper recessions, as GDP growth trends downward over the decades. I do not believe that is inevitable. In fact I contend it is the natural result of policies that have redistributed wealth upward from the middle class.
Study after study has shown that the share of income going to labor vs. owners and financiers has declined relentlessly for over a generation. As less income has accrued to the middle and working classes, they have had less and less savings to fall back on. What the graph of the leading relationship of the real personal savings rate to GDP above shows is that a result of this policy-driven transfer of wealth, the overall growth rate of the economy has suffered for nearly 3 decades.
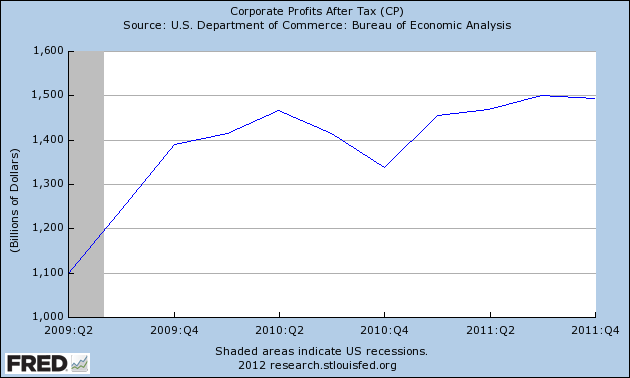
And the closer we come to the point where transfering wealth upward from the middle class becomes akin to squeezing blood out of a stone, the less ability there is even for corporations to generate greater profits. This is the graph of corporate profits after tax since the recession bottom:

Corporate profits at their post-recession peak have been 10% higher than their prior peak, but the increase shows signs of being short-lived.
The alternative to the type of economy predicted by Laksham Achuthan, in which the majority of consumers have reduced savings to spend, corporate profits stall, and growth is lackluster for a long time, is to implement policies that favor a greater share of income winding up in the savings of the middle class. Henry Ford would know that in the long-term, this even favors the well-being of the 1%.
