For the last couple of weeks, I've been revisiting my forecast from the beginning of the year, which was for weakness in the first half followed by stronger growth in the second. So far I have been piling up the evidence that the expansion will continue.
It's not as if there aren't some significant problems, though.
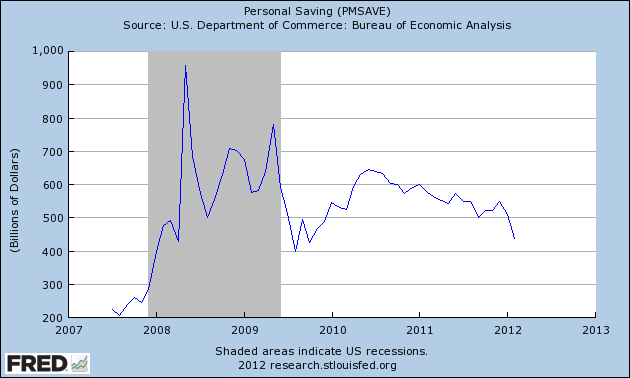
First of all, I've already touched on consumer spending in the face of increasingly high gasolilne prices, and the fact that wages haven't kept pace with inflation for over a year. As a result, people are digging into their savings, and at a more precipitous rate since the beginning of the year:
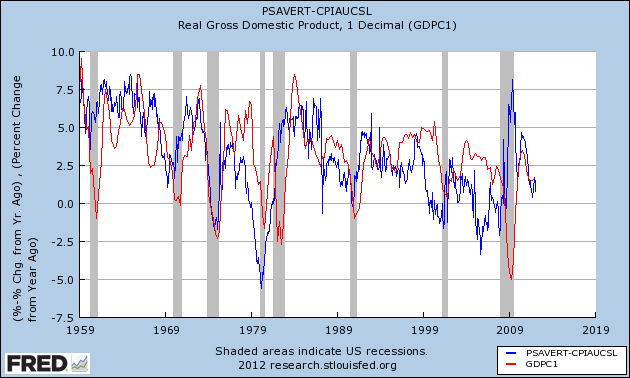
In the past, I've noted that the real personal savings rate, i.e., the savings rate minus inflation (blue in the graph below), is an excellent long leading indicator, by about 12-24 months, of GDP (red), albeit with a fair amount of noise:
Here's a close-up of the past 11 years:
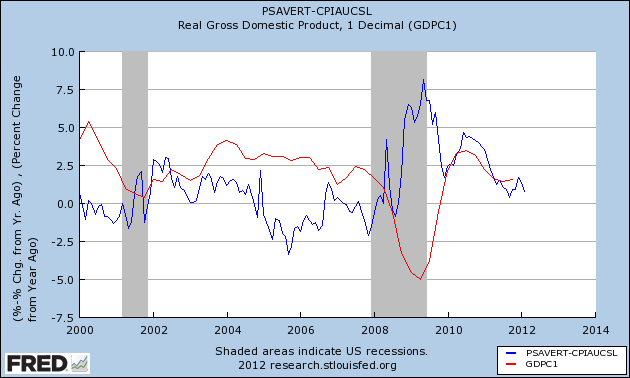
The 2010 increase in real savings started to feed through into GDP towards the end of 2011. Once that is done, the real personal savings rate predicts serious trouble ahead.
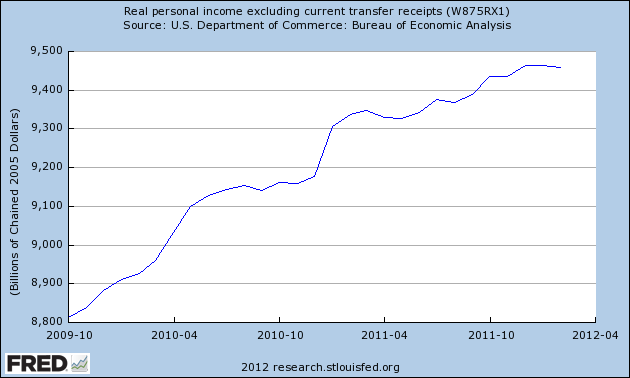
Real income has stalled again, and is down slightly since December 2011. This is one of the four data series typically used by the NBER to date recessions. While not a good sign, note that the graph shows this has been a problem off and on ever since the recovery started:
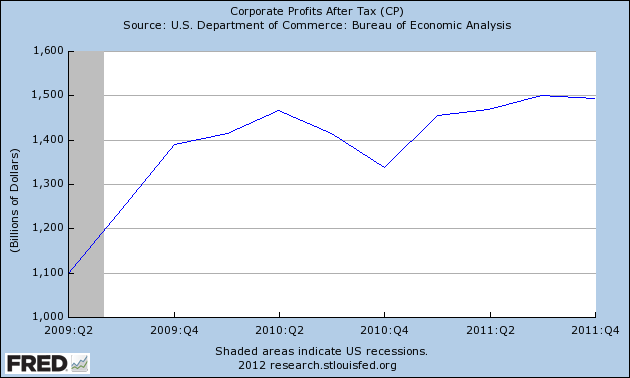
Secondly, not only are consumer incomes and savings a problem, but corporate earnings (a long leading indicator) also look like they are peaking or have already peaked:
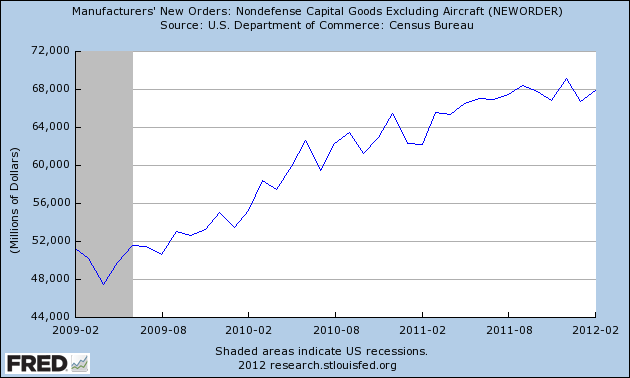
Probably not coincidentally, durable goods (a short leading indicator) look like they have rolled over:
The slowing growth of manufacturing is also shown by the ISM new orders index (blue) and vendor deliveries index (red):
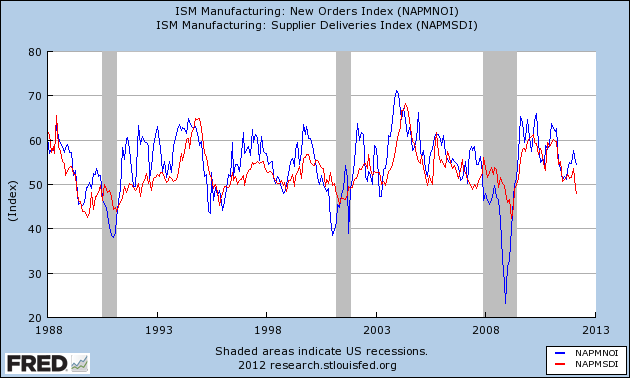
Both of these are also short leading indicators. New orders in particular haven't rolled over as of this point, but could do so quickly based on past experience.
Finally, the pattern of commodity prices (green), producer prices (red), and consumer prices (blue) YoY change mirrors that we saw in both the 2001 and 2008 recessions:
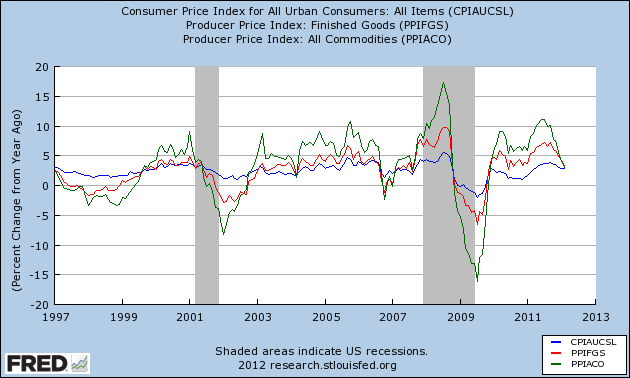
At approximately the midpoint of each of those recessions, prices fell, with commodity prices - the most volatile - falling more than producer prices, which in turn fell more than consumer prices. Note, however, a couple of occasions (2004, 2006) where commodity and producer prices fell, but not faster than consumer prices. In those cases, the economy was not so weak that it went into actual contraction. The pattern of these prices - i.e., if the YoY change in commodity prices is significantly less thant the YoY change in consumer prices - will tell us in the next few months if we escape without a recession or not.
The economy does show definite signs of weakness. What remains is to add up the ledger of the positive and the negative trends I've discussed over these last couple of weeks..