


First, I'm starting to feel like the great complainer regarding the latest developments in the equity markets. However, consider the above three charts, which are in the 30 minute time frame.
The IWMs opened the year by gapping higher and then fell. While it has rallied since then, it is still below the highs established on the gap higher. The IYTs are in the same boat. The SPYs are the same way, although they have moved a bit closer to their highs. The QQQs are the only averages who have continued their break-out and advanced to higher levels. In short, there just isn't any follow-through on the rally, and the length of time from the original pop to now is a big deal.
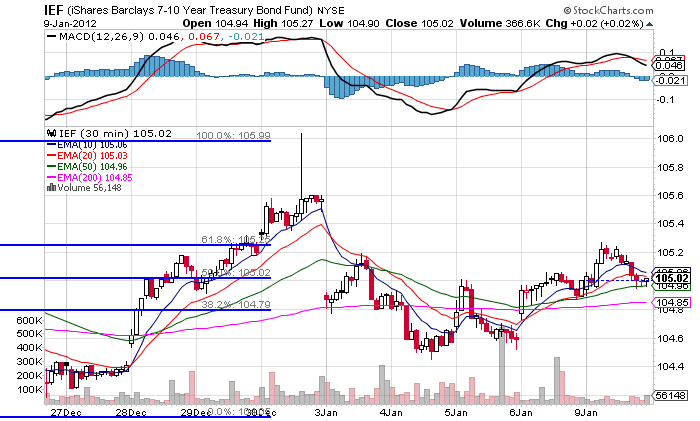
In addition, we see that the IEFs gapped lower, but haven't sold off any more. If we were seeing a big rush into equities, we'd probably be seeing a bigger sell-off in the treasury market.

After hitting resistance at the 38.2% Fibonacci level and selling off into the EMAs, the grains ETF has a nice move higher yesterday. Notice the upward momentum implied by the EMAs -- the shorter EMAs are rising and the 50 is also turning positive, although at a smaller angle. We see overhead resistance at the 38.2% Fib level and the 200 day EMA.

Oil is still trapped below resistance established in November. The volume indicators tell us there has not been a major move out of the security, but we also haven't seen a big rush in yet.