Wednesday, September 7, 2011

The Two Year Bull Market Is Over


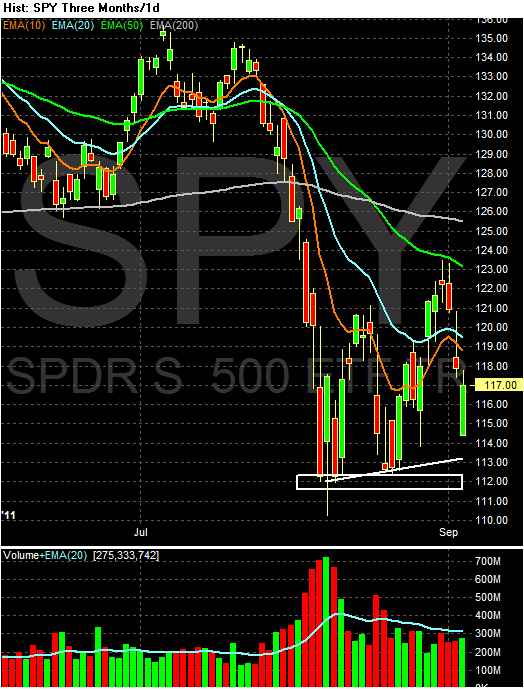
The above charts show all the major average ETFs and the transports.  All confirm that the two year bull run is over, as all have broken uptrend lines in place for over two years.

Your Bonddad Blog Link Fest

  1. Kash -- a MUST read -- on the Swiss National Bank's currency decision
  2. Japan keeps rates low
  3. Analysts just can't say sell (yes, most analysts suck)
  4. More "currency wars" are on the way
  5. Riksbank halts rate increases (for now)
  6. Searching for safe haven currencies after the SNB move
  7. German industrial production surges
  8. Looking deeper into the "regulations are killing job growth" argument.
  9. Virginia cotton crop downgraded after hurricane Irene
  10. Transportation volumes are decreasing
  11. Global manufacturing is down, but global services are holding their own 
  12. How much copper is being stored off market?

Two Positive Indicators: PCEs and ISM

Despite all of the bad news lately (and there has been a ton of it), there have been two bright spots -- personal consumption expenditures and the latest ISM services number. PCEs comprise 70% of GDP growth, so they are an important data series.  Consider the following charts:


After stalling for the last four months (for the entire second quarter), real PCEs popped higher last month by .5%. 


There was a nice bump in durable goods -- largely due to an increase in auto sales


But non-durable goods are still mired in a tight range.   


Services, however, saw a nice bump as well.  Considering these comprise about 65% of PCEs, this is an important increase.

PCEs in the second quarter were stagnant -- as evidenced by the near level position they were in for the last four months.  However, at the beginning of the third quarter, there is a good bump.  Given the overall weakness we've seen in the other numbers (especially employment) this data series is in danger of being seriously weakened going forward -- that is, another round of stagnation much like the second quarter is a more than slight possibility.  But at least the third quarter GDP number has a nice jump coming out of the gate.

Today's ISM Services report was also good.
"The NMI registered 53.3 percent in August, 0.6 percentage point higher than the 52.7 percent registered in July, and indicating continued growth at a slightly faster rate in the non-manufacturing sector. The Non-Manufacturing Business Activity Index decreased 0.5 percentage point to 55.6 percent, reflecting growth for the 25th consecutive month, but at a slower rate than in July. The New Orders Index increased by 1.1 percentage points to 52.8 percent. The Employment Index decreased 0.9 percentage point to 51.6 percent, indicating growth in employment for the 12th consecutive month, but at a slower rate than in July. The Prices Index increased 7.6 percentage points to 64.2 percent, indicating that prices increased at a faster rate in August when compared to July. According to the NMI, 10 non-manufacturing industries reported growth in August. Respondents' comments remain mixed. There is a degree of uncertainty concerning business conditions for the balance of the year."
The report also showed a majority of industries expanding verses contracting (10 were expanding;  were contracting).

There are plenty of reasons to be concerned right now: manufacturing is contracting, employment is in poor shape and Congress is a mess.  However, the two data points above represent wide swaths of the economy and their positive readings indicate all hope is not lost. 


Morning Market RoundUp


Yesterday, there were two important stories.  First, the ISM services printed better than expected.  This provided much needed enthusiasm.  Secondly, the Swiss National Bank established a hard franc/euro exchange rate, essentially lowering the value of their currency to increase the competitiveness of their respective businesses. 


Notice the incredibly large spike in the dollar index yesterday on very large volume.  The overall move was 1.65% -- a large move for a currency.  The dollar is still trading in a range between 20.9 and 21.9, so the overall effect doesn't indicate a major change in the market's tenor -- yet.  However, this is the kind of move that can fundamentally change markets, so keep your eyes open.  But for that to happen, the technicals would have to change, and considering the EMA picture is still bearish, we'll have to wait and see.


Conversely, the euro is at the bottom of a trading range, just barely hanging on to technical support.  But yesterdays move also sent the euro below the 200 day EMA on high volume, adding weight to the events.  But, the EMA picture is still very jumbled, with the shorter EMAs in a very tight range, so, like the dollar, we'll have to wait and see what happens next.  Just for kicks, I'd seriously think about shorting around 138.5 if confirmed on volume and further deterioration in the fundamentals.  


The ISM reading added some strength to the market.  Notice the next day-long rally and the fact the market ended on a high point on increasing volume.  


But one days action does not a bull market make, as the daily chart is still negative.  The EMAs are bullishly aligned and no rally in the last few months have been able to maintain momentum.  And while the intra-day price action was good, the lack of volume is concerning, as it indicates that traders are less than enthused about the current market situation.  I'm still expecting a retest of the 112 area at this point.  

Regarding the Treasury Market, Tim Knight over at Slope of Hope notes that the 10 year's yield is now below the levels seen in the financial crisis.  

Tuesday, September 6, 2011

Thoughts on the Employment Situation, Part I


After last week's dismal employment report, I though a macro level view of the employment situation would be in order.  So, let's see what the data says.


Weekly initial unemployment claims are still hovering around the 400,000 mark -- where they have regrettably been for the better part of the last year.  However, we haven't seen a large spike in this number, telling us we're not seeing a massive amount of firing -- or, more specifically, the level of firing associated with the start of a recession.  Instead, businesses are letting go of employees at a pace that is slightly more than average.


The above chart shows total nonfarm employment.  The chart tells shows massive job cuts during the recession.  But most importantly, it shows that, while there has been some job growth, it has been nowhere near enough to pick up the slack of the job losses from the recession.  It's also as though employers simply cut off 7%-10% of the economy and left it hanging.


For me, the above chart is the most telling.  The lower a person's educational achievement, the higher their unemployment rate.  Going back to the previous chart, it looks as though employers cut a lot of jobs where educational achievement wasn't required.  Assuming that to be true, it also means the economy has a very large problem: bringing back those jobs probably isn't going to happen quickly -- if at all.

The central problem is simple: while there is still a slight bleed in the form of job losses, there is little gain to offset those losses.  

Utter Contempt

Between being buried in work and feeling incredibly depressed about the overall political situation, I wound up taking a much needed break last week.  And while I am back, I have to admit a feeling of complete and utter frustration with the situation in Washington.  At time when the economy is teetering on the edge of a recession, we can point to Washington as being a primary contributing factor in our current economic malaise.  It should come as no surprise that we started to get really dismal domestic numbers right around the debt debate flare-up.  But that was actually not the beginning of what I noticed to be the complete degradation of our national political dialog.

I think it was about a year ago when we had to live through the health care town hall debacle.  It was during this time that I first began to seriously doubt our national ability to actually deal with a problem.  It started with a protester who informed his Congressman to "keep the government out of my medicare."  How on earth would you respond to that statement -- I mean, besides being utterly stunned by its sheer stupidity?  How do you actually have a meaningful conversation about how to deal with a very complicated problem (such as health care costs) when people want you to somehow keep the government out of government insurance?

Just when I thought our national debate could not sink any lower, we had the national debt crisis.  This should have been a simple vote, nothing more.  Instead, we had a group of people in Congress who actually thought it was a good idea to vote (or, more specifically, not vote) for a national default.  To even think this is a good idea should demonstrate to anybody how completely debased out national dialog has become.  The US yield curve is a fundamental component of international finance; to threaten it's viability in any way is to essentially invite the possibility of financial Armageddon not just for the US, but for the world.  And yet, we witnessed a group of people who invited just that -- and in fact were egged on by a not inconsequential group of pundits who agreed that committing financial suicide was a good idea.

And finally -- again, just when you thought we couldn't see a higher level of dysfunction -- we have the President's speech issue.  The level of petty bickering that occurred over the jobs speech is embarrassing on an international level.  On the one hand, we have a party (the Republicans) whose dislike of the president is obviously a seething hatred.  They have even stated they will not vote for an extension of the payroll tax break that expires in December -- which would be an obvious breaking of their little Grover Norquist pinky swear on no tax hikes --- because the president is for it.  That is beyond childish.  On the other had, we have a president who is so completely inept and unable to actually accomplish anything that it really doesn't matter.  Frankly, I don't think the president can make a peanut butter sandwich without screwing it up.  Yet somehow he's going to propose a jobs plan and a deficit reduction plan within the period of a week (or maybe in the same speech). 

Several weeks ago, I wrote a piece titled, If A Recession Comes, Blame Washington, where I wrote:
The problem with the debt deal is it took government action off the table at a time when governmental action is needed. Instead of borrowing at insanely low rates, investing massively in a degrading US physical and intellectual infrastructure, Congress is taking action off the table. Remember that governmental spending is a component in the GDP equation -- a fact lost in Washington policy debates, as is the different between consumption and investment. In short, Washington is focused on exactly the wrong thing at exactly the wrong time and as such should bear the brunt of any economic slowdown we face.
But now it's more than just taking government action off the table; it's that both parties have now proven they are utterly inept, albeit it in different ways.  And frankly, that is deeply troubling, especially considering that the economy is now hanging on by a thread.

I've seen many people comment that this is more of a Republican issue -- that is, that the Republicans are more to blame than Democrats.  I would respectfully disagree with that statement.  While the latest Republican bunch in Congress is clearly hyper-partisan and hell bent on doing everything they can to derail the President, I would ask this: please list 5 points that outline what the Democrats plan is.   You can't, because no one really knows.  I've seen a bunch of trial balloons floated and ideas bandied about, but I have yet to see a concrete list of points that all Democrats are rallying around in any meaningful way.  And that -- in addition to utterly incompetent leadership -- is the central problem with the Democrats.


If the Opposite of Pro is Con .....

From the WSJ:


The sharp slowdown in the euro-zone economy during the second quarter was due to a combination of government spending cuts and a drop in consumer spending, raising doubts about the wisdom of pushing ahead with austerity programs and further increases in the European Central Bank's key interest rate.
I realize I'm preaching to the choir here, but news reports continually note that a decrease in government spending -- AKA austerity -- is a big contributing factor to the economic slowdown in Europe.  I find it so completely amazing that no one in Washington is even thinking about major programs -- especially at a time of weak growth and negative real interest rates on the 10-year Treasury.

This leads to an interesting idea -- is Congress hurting the economy?  
Democrats and Republicans say job creation is a top priority as they return to work this week, but there is a growing body of evidence that Congress is actually hurting the economy.

A protracted budget stalemate in the first half of the year caused nervous federal agencies to sit on billions of dollars that should have been circulating through the economy.

A vitriolic debate over raising the debt ceiling this summer spooked consumers, caused turmoil in financial markets and led to a first-ever downgrade of the United State's credit rating by Standard & Poor's.
A spat over subsidies for rural air serices in late July idled airport construction projects across the country and threw thousands temporarily out of work for several weeks.

Businesses that had to suspend their airport construction projects are still trying to recover from the disruption.


Morning Market Roundup

Wow -- did I ever need that break.  First, I want to thank NDD and Silver OZ for filling in the gaps on the blog while I got a break. Secondly, I want to announce a change in the way I look at the markets.  Rather than doing one market per day, I'm going to do each market every day -- or, more specifically, each market given it's importance the preceding trading day.  Something the one market per day approach misses is the inter-relationship between the markets -- that is, when market x is up, the money came from market y.  These relationships are incredibly important and help to explain the overall tenor of the markets in general.  So, that being said, let's start with the SPYs:


With the SPYs, notice we have the big sell off on increasing volume, when prices moved through the 200 day EMA along with the other EMAs.  We have since tested the 112 level, providing good technical support.  Prices bounced higher, through the 10 and 20 day EMA, but have hit resistance at the 50 day EMA.  Most importantly, the 200 day EMA is now moving lower, indicating the big, long-term trend is down, rather than up.  This is a huge, fundamental change in the market.


The 10 day, 5 minute chart shows that prices have moved through near-term support at 120.5 and 119.5, and have support at 117 with secondary support at 116.


The long end of the Treasury curve has moved though resistance.  However, neither the IEIs nor IEFs have followed suit.  More importantly, notice the technical underpinnings of the TLTs -- the A/D and CMF show either stagnant or declining inward flowing volume and the MACD is weakening.  My guess is the long end broke out because there is downward real room to run on the yield.  One year inflation is running at 3.6%, meaning the 10 year now has a negative yield of about 1.5% with the 30 year now at -.3%.  The point is real negative rates of return typically sour investors in an asset class, which makes me seriously wonder how much upside potential is left in the Treasury market.


The equity markets are still incredibly weak; the deterioration of the fundamental situation is still a huge concern to traders, so I would not expect any strong moves to the upside.  While I could see a quick spike up in the Treasury market, the fact that we're looking at negative yields is a pretty heavy drawback to additional upside moves.  So -- where will the money flow? 


Expect gold to be the primary recipient of a bullish drive.  Notice the continued upward move over the last year, with a bullish EMA picture.  The A/D and CMFs show continued moves into the security, and the MACD has retreated a bit to allow for further advances.  I would expect GLD to continue moving sideways for the next week at least as it consolidates gains, but I don't see a major sell-off in the current environment.

Saturday, September 3, 2011

Weekly Indicators: lack of confidence hurricane warning edition

- by New Deal democrat

In the rending of garments over yesterday's jobs report, it is easy to overlook that most of the monthly data reported last week was actually good. Personal income and spending both rose at a robust clip. The Chicago PMI came it at 56.5. The ISM manufacturing index remained slightly positive. Factory orders surprised to the upside. Other series did not decline as much as feared - Case Shiller for example declined, but less than expected, and the YoY% of decline may have troughed. Only consumer confidence, as expected, plummeted. Even the jobs number is best considered ex-Verizon strike at +45,000.

The high frequency weekly indicators continued to reflect the pummeling taken by consumer (and employer?) confidence most likely primarily due to the debt debacle.

Let's look at the signs in order of their magnitude again this week:

Money supply -a leading indicator - continued its surge. M1 was up 1.0% for the week, and also increased 5.4% m/m, and 20.1% YoY, so Real M1 was up 17.5%. Iincreased 0.2% w/w, and also increased 2.4% m/m, and 10.2% YoY, so Real M2 was up 7.6%. The YoY increase in M1 in the last month is the highest in the history of the series. The YoY increase in M2 is at readings typically associated with the end of recessions rather then their onset. While this is an emotional, probably panic-driven move, it is still very positive for the economy going forward.

The Oil choke collar tightened slightly last week, as Oil finished at $84.12 a barrel on Friday. It is still about $10 below its recession-trigger level. Gas at the pump rose $.05 to $3.63 a gallon. Gasoline usage was -1.7% lower than a year ago, at 9229 M gallons vs. 9386 M a year ago. With few exceptions, gasoline usage has been negative for almost 6 months. It continues to surprise me how little weight gasoline prices are given in most economic commentary this year.

The Mortgage Bankers' Association reported that seasonally adjusted mortgage applications increased 0.9% last week. For the third week in a row, the YoY comparison in purchase mortgages was negative, down -8.2% YoY. Refinancing decreased 12.2% w/w due to an increase in interest rates. Refinancing has surged recently with sharp decline in interest rates.

Median asking house prices from 54 metropolitan areas at Housing Tracker showed that the asking prices again declined -2.0% YoY. This is the smallest YoY decline in the 5 year history of this series (YoY measurements were possible beginning in April 2007). The areas with double-digit YoY% declines remained at 6. The areas with YoY% increases in price also remained at 13. Thus, one quarter of all metro areas are now showing YoY increases.

Retail same store sales continue to perform well. The ICSC reported that same store sales for the week of August 20 increased 3.0% YoY, and increased 0.1% week over week. Shoppertrak reported a 5.0% YoY increase for the week ending August 20 and a WoW increase of 0.7%. This is the seventh week in a row of a strong rebound for the ICSC, joined for the fourth week by Shoppertrak.

Adjusting +1.07% due to the 2011 tax compromise, the Daily Treasury Statement showed that for all of August 2011, $144.0 B was collected vs. $135.5 B a year ago, for an increase of $8.5 B. For the last 20 days, $119.4 B was collected vs. $111.9 B a year ago, for an increase of 6.7%. With the exception of one week, withholding tax collections have rebounded strongly for the last 6 weeks.

The American Association of Railroads reported that total carloads decreased -0.5% YoY, down 3700 carloads YoY to 536,000 f. Intermodal traffic (a proxy for imports and exports) was, unusually, also down 1700 carloads, or- 0.5% YoY. The remaining baseline plus cyclical traffic was down 2500 carloads, or -0.8% YoY%. Rail traffic has been negative YoY for 4 of the last 8 weeks. Using the breakdown of cyclical vs. baseline traffic that was graciously provided to me by Railfax, baseline traffic was down 9200 carloads, or -4.7%YoY, while cyclical traffic was up 6700 carloads, or +6.2% YoY. Please note that rail traffic in this reporting period and next week as well may have been affected by Hurricane Irene.

Initial jobless claims coninued their recent range just above 400,000, as the BLS reported Initial jobless claims of 409,000. The four week average increased to 410,250. Jobless claims remain lower than for all but two months in the last 3 years.

The American Staffing Association Index remained at 87 for the third week. This series has completely stalled, and in fact has decreased one point since peaking one month ago.

Weekly BAA commercial bond rates increased .11% to 5.40%. Yields on 10 year treasury bonds increased only .02% to 2.19%. This indicates a slight but continuing increase in the relative distress in the corporate market, indicating increased relative fear of rising corporate defaults.

Finally, one metric which has been extremely telling in the last 45 days has been the daily Consumer Confidence tracking poll by Gallup. It began to decline precipitously on July 5. It bottomed on August 2 and essentially remained at that bottom - until the last few days, when it regained about 1/3 of the ground lost.

For now, gasoline usage and mortgage applications continue to be strong negatives, joined less substantially by temporary staffing and rail traffic. These are offset by a surge in money supply, withholding tax payments, retail sales, and a near-leveling off in house prices. Initial jobless claims are a neutral. Since so much of the poor data in the last month or so may have been provoked by a profound loss of confindence due to the debt debacle, the significant upturn in the last few days of the Gallup economic confidence poll may signal that the poor news is not becoming self-reinforcing. Keep your fingers crossed - and have a great Labor Day weekend!

Friday, September 2, 2011

The "0" Jobs Report

With Bonddad on vacation, I thought I would step in and summarize this less than stellar jobs report (its me SilverOz).

Let's start out with the headline numbers, which showed 0 job creation on the Establishment Survey and included downward revisions for both June and July as well. The report also showed that several leading indicators from the report also declined (hours worked and pay) marginally. And while the official U-3 unemployment rate remained unchanged at a very high 9.1%, U-6 picked up a tenth of a point to rise to 16.2% and my personal favorite measure, U-5, did decline a tenth to 10.6%. In good news (if this can be called that), both the participation rate and employment-population ratio gained a tenth of a point and in even better news, the Household Survey showed a gain of 331,000 jobs last month.

In other "good" news, the number of both those not in the labor force and those not in the labor force that want a job declined as over 350,000 people entered the labor force last month. And while we need these re-entrants, we must also recognize that they will have a dampening effect on the U-3 unemployment rate as they return.

Obviously, the Verizon strike had an impact on the numbers, but even discounting that (since it will be added back in next month and needs to be discounted then as well), we would only be up 45,000 jobs. Government continues to be a drag on employment, shedding another 17,000 with all of those losses essentially coming from local governments.

Once again we are also seeing the real return of an educationally bifurcated economy, as those with either some college or a college degree gained (Household Survey numbers) 449,000 jobs last month, which was offset by losses of 581,000 jobs by those with just a high school diploma (all numbers are for ages 25+). The economy actually appears to be doing ok for those with a post-secondary education, but still mired in losses for those without.

Overall, this report was particularly bad as not only did it show no headline job growth, but 2 of the leading indicators from the report dipped this month and it continues to showcase a deceleration of the economy and the jobs picture that has materialized over the past few months. Once again though, this seems (at this point) relegated to those without higher educational attainment and the youth (ie under 25) as opposed to broad based declines (again, at this point). the report for September should be especially interesting, as it will be the first report that would fully include the fallout of the recent spate of negative numbers and loss of confidence (as we must remember that hiring decisions are typically made at least a full month prior to actually taking place).

And once again, this summary was brought to you by SilverOz.

Notes on the employment report

- by New Deal democrat

Although there were some important silver linings, there are a lot of red flags in this mornings' employment report, beyond the 0 change in jobs in August.

The three big silver linings were:

1. leaving aside the Verizon strike, jobs in August were actually up +45,000, and private payrolls were up +62,000.

2. the household survey showed a gain of +331,000 jobs. Over the longer term, this series and the establishment survey tend to converge, so that's a positive.

3. the U-6 unemployment rate declined from 16.3% to 16.1%, and 165,000 people re-entered the labor force.

In neutral data, the usual unemployment rate remained steady at 9.1%. The manufacturing workweek, one of the 10 Leading Indicators, was steady.

But there are some major red flags.

1. Aggregate hours declined. This is one of the coincident indicators used by the NBER or at least a few of its members to determine beginning and ending dates for recessions. Here's the graph from last month:


In the above graph, payrolls (red) went sideways, and aggregate hours (blue) declined .2 this month.

2. Manufacturing employment declined -3,000. This is a leading indicator for employment, including in the pre-WW2 deflationary era.

3. Earnings per hour declined $.03. This is wage deflation in the face of 3%+ price inflation.

4. June and July were revised downward, June to +20,000 and July to +86,000. This is what tends to happen in recessions, not in recoveries.

5. The biggest negative, in my book, is what happens to the below graph comparing initial jobless claims to payroll employment (the graph does not include this morning's data):


With today's data, we appear to have a break with the blue recovery series (0 jobs at slightly over 400,000 average jobless claims). Because the striking Verizon workers were able to file jobless claims, I can't lay the change off on that strike. The graph becomes consistent with being on the cusp of a double-dip recession.

Thursday, September 1, 2011

Looking at construction spending

- by New Deal democrat

One simplified way to look at why the recovery in jobs in the last two years has been so anemic is simply to notice that construction has continued to fall throughout. At no point has construction spending for either residential or nonresidential construction turned positive on a YoY basis, but both may have made bottoms and its possible that today's data could put us very close to being YoY positive, if not over the top. Estimates are for construction spending to be flat.

I'll be unavailable when the numbers get reported at 8:30 a.m. eastern time. Bill McBride a/k/a Calculated Risk will do his usual excellent job of explaining both the residential and nonresidential numbers. Here's what I'll be looking for.

Here's total construction spending for the last year, in $ millions. The projection is that today's number will be unchanged from last month's report. If that happens, then we will be only about 2% under spending from 12 months ago:


Since ultimately its all about jobs and income, let's compare total construction spending with construction jobs. As you can see, there's an unsurprisingly close fit between the two (comparing YoY% changes in each):


Note that being only 2% negative would be the best showing in nearly 4 years, and would bode well for construction employment.

As indicated above, construction spending gets broken down into several parts, including residential and nonresidential spending. Since housing always leads the economy, frequently by over a year, spending on residential spending is an important metric.

It ought to be unsurprising is that residential construction spending tracks housing permits closely, with a few month lag (first you get the permit, then you build the house). Housing permits have improved a little in the last few months, so there is a reasonable possibility that residential construction spending increased last month:


In absolute numbers, residential construction spending appears to have bottomed in March of this year at $227.254 Million. One year ago it was $235.589 Million. Last month it was $235.752 Million.

So even if residential spending is simply unchanged, then residential spending may turn YoY positive for the first time in half a decade (except for a few months when it was distorted by the $8000 housing credit), adding to the evidence that this very important and leading part of the economy has finally bottomed out.

I'll check back in later to see how we did.