Although there were some important silver linings, there are a lot of red flags in this mornings' employment report, beyond the 0 change in jobs in August.
The three big silver linings were:
1. leaving aside the Verizon strike, jobs in August were actually up +45,000, and private payrolls were up +62,000.
2. the household survey showed a gain of +331,000 jobs. Over the longer term, this series and the establishment survey tend to converge, so that's a positive.
3. the U-6 unemployment rate declined from 16.3% to 16.1%, and 165,000 people re-entered the labor force.
In neutral data, the usual unemployment rate remained steady at 9.1%. The manufacturing workweek, one of the 10 Leading Indicators, was steady.
But there are some major red flags.
1. Aggregate hours declined. This is one of the coincident indicators used by the NBER or at least a few of its members to determine beginning and ending dates for recessions. Here's the graph from last month:
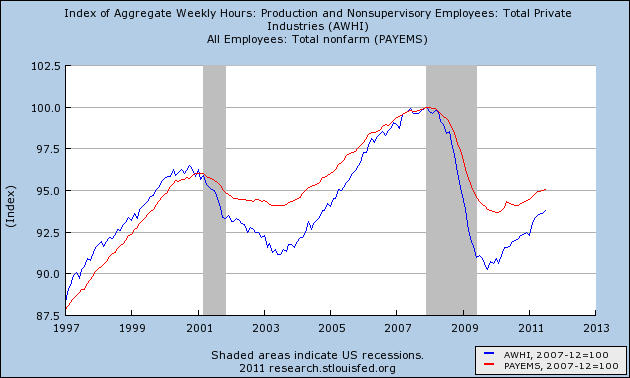
In the above graph, payrolls (red) went sideways, and aggregate hours (blue) declined .2 this month.
2. Manufacturing employment declined -3,000. This is a leading indicator for employment, including in the pre-WW2 deflationary era.
3. Earnings per hour declined $.03. This is wage deflation in the face of 3%+ price inflation.
4. June and July were revised downward, June to +20,000 and July to +86,000. This is what tends to happen in recessions, not in recoveries.
5. The biggest negative, in my book, is what happens to the below graph comparing initial jobless claims to payroll employment (the graph does not include this morning's data):
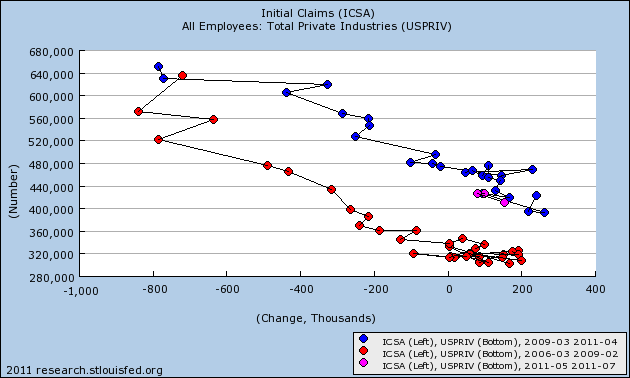
With today's data, we appear to have a break with the blue recovery series (0 jobs at slightly over 400,000 average jobless claims). Because the striking Verizon workers were able to file jobless claims, I can't lay the change off on that strike. The graph becomes consistent with being on the cusp of a double-dip recession.