Many if not most times you will see me cite year-over-year trends in economic data. This is because prior research has been based on YoY trends, and also because many, many data series have marked seasonality. So, for example, with rail traffic you simply can't compare wintertime post-Christmas carloads with late summer or autumn carloads. Similar issues exist for tax withholding and for state tax receipts. Thus the only valid way to see a trend is YoY.
But where there is no seasonality, or where the data has already been seasonally adjusted, YoY comparisons lag turning points. For example, weekly initial jobless claims are seasonally adjusted by the BLS. Waiting for a YoY change there in 2009 would have completely missed the turning point. YoY initial claims did not turn positive (i.e, lower) until November 19, 2009, even though the bottom was made on the week of March 28, 2009.
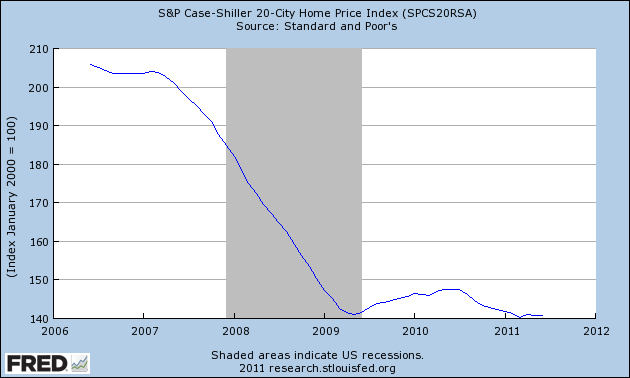
Which brings us to housing prices. Note: I'm discussing nominal prices here, not "real" inflation adjusted prices. Yesterday the Case-Shiller housing indices for June were released. Here's a graph of the Case-Shiller 20 city index for the last five years:

The Case-Shiller data in the graph above IS seasonally adjusted. So we don't have to wait for YoY changes to make valid statements about the data. Well, here is the data for the 20 city index shown above for the last 6 months:
2011-01-01 141.75
2011-02-01 141.31
2011-03-01 140.30
2011-04-01 140.94
2011-05-01 140.84
2011-06-01 140.76
As I pointed out yesterday, the variation in the index over the last 6 months is less than 1%, and on a seasonally adjusted basis we have not made a new low in 3 months. In fact we are less than 1% below where this index stood in mid- 2009 (before most of the $8000 housing credit distortions kicked in).
Yes, it's only nominal and not "real," and by no means is it clear that March will prove to have been the absolute bottom, but even if there is some further deterioration, we are probably near the bottom in nominal (not "real") housing prices. In fact the bottom in housing prices may be staring us right in the face.
----------
P.S.: It may be tempting to think that the overhang of foreclosures will drive house prices further down. But consider that the same overhang existed in January. It existed in February. It existed in March. And April, May, and June, too -- but it did not drive prices down in those six months. Is anything different about the foreclosure overhang now than during the last half year?