First of all, if Jimmy Hoover Obama has any honor, he will do as LBJ did in March 1968 and announce that he is no longer seeking renomination to a second term. One-and-fifteen football coaches typically do not spend a lot of time telling the fans how they hope to improve their record in the next season. In researching pre-WW2 economic indicators, I came across a quote by Prof. Geoffrey Moore that the 1937 recession came on very fast with little warning. Politically-induced contraction can strike literally overnight. Beyond that, I have little to say beyond what Profs. Thoma, Krugman, and DeLong, and Armando, Digby, and Riverdaughter have already said.
In the meantime, since I haven't spent much time on this lately, let me bring you up to date on some employment metrics, in anticipation of this Friday's July jobs report.
First, here is an updated scatterplot graph showing the relationship between initial jobless claims and private nonfarm payrolls for the last five years. Red is the descent into the recession, blue is from the monthly nadir for jobs in March 2009, and pink is the last two months :
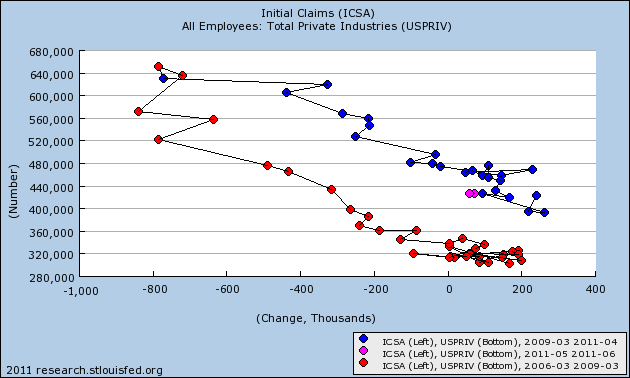
Currently expectations are for 75,000 private jobs to have been added in July. Initial jobless claims did decline in July, but if we are descending into a double-dip, expect the pink line to be extended to the left over the next few months.
In a similar vein, here is the updated Thumbcharts graph comparing the YoY 6-month average of initial jobless claims with the YoY average of jobs (i.e., comparing 0-6 months ago with 12-18 months ago). This relationship has held up rather well in the last few months:
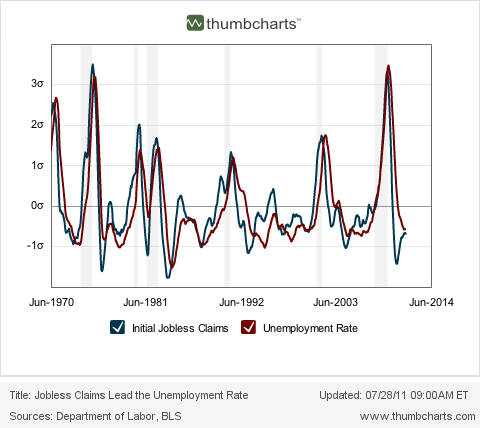
Since this graph tells us that the YoY jobs metric is likely to remain very positive, it suggests that outright negative numbers should not be expected yet.
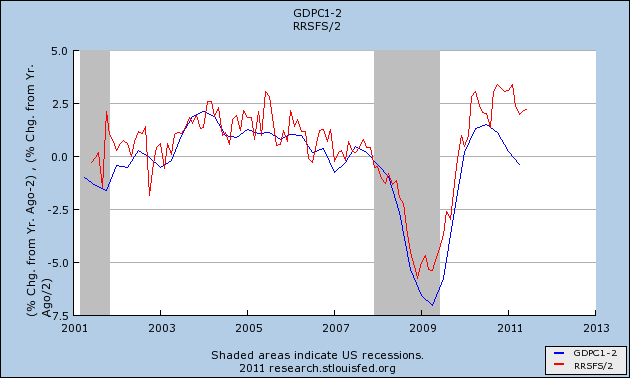
Next, here are updated comparisons of real retail sales and GDP with nonfarm payrolls.
Here are real retail sales:
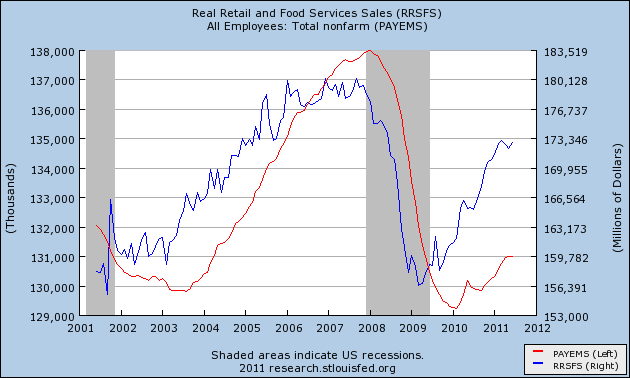
Real retail sales have not made significant improvements in the last few months, but they haven't turned negative either. As they have a 60 year record of leading the jobs numbers, I would not expect anything worse than a stall in job growth at this time.
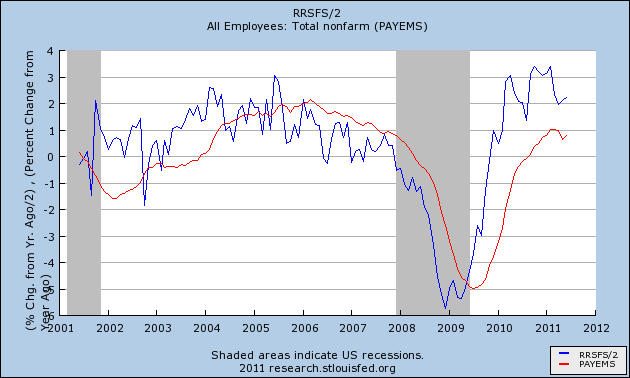
Here is the YoY% comparison, to the same effect:
But on the other hand, here is GDP compared with jobs:
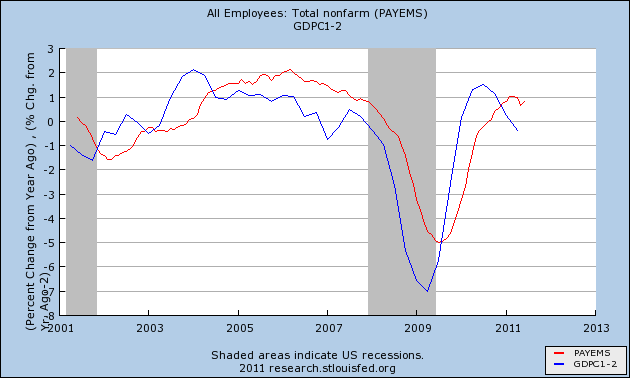
GDP also has a well-known relationship with jobs, for example see Prof. Menzie Chinn's discussion of Okun's law as applied to the recent GDP revisions. The GDP numbers predict an entirely different, and worse, scenario, of continued deterioration in the jobs picture (Note: since this graph measures YoY% change, deterioration might just mean "less positive" numbers than a year ago, vs. outright losses.)
In fact, since the beginning of the year a very sharp divergence between GDP and real retail sales has developed. Here is the graph:
It is difficult to reconcile this divergence, but I suspect it has to do with energy costs and with the sudden stall in manufacturing after the Japanese tsunami.
The above relationships give us differing results. I would put the range of reason anywhere between about -60,000 jobs to +140,000 based on what we know now, with the most likely range between 0 and +80,000.