There has been a big scare reminiscent of last year as to whether the economy is about to enter, or even has already entered, a "double-dip recession." Although the Oil choke collar and Washington lunacy, along with a few other factors, have managed to bring the economy nearly to a stall, unless a foreign-origin contraction is sneaking in "under the radar" unseen even in LIBOR, EURIBOR, or TED spread rates, the simple fact is that the vast majority of the US economic data - including the majority of both modern and pre-WW2 deflationary era Leading Indicators - refute the notion that a recession has begun or is even close.
The NBER focus
In the first place, we know that a recession is actually called by the NBER, and we know that they focus of 4 data series - Industrial Production, employment, real retail sales, and real income. A fifth series, aggregate hours worked, is also important to at least one member. As of yesterday, we know enough to know that all five of those series are positive through July.
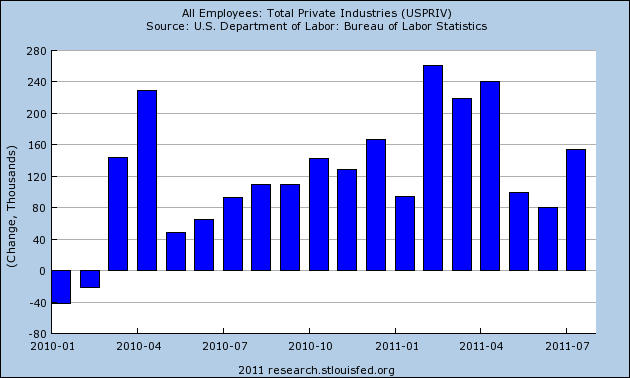
Here's employment, which has been positive ex-census for 17 months straight:
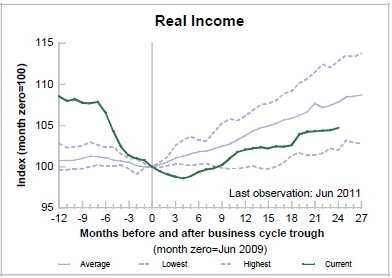
Real income continues to increase, albeit at a woefully inadequate pace:
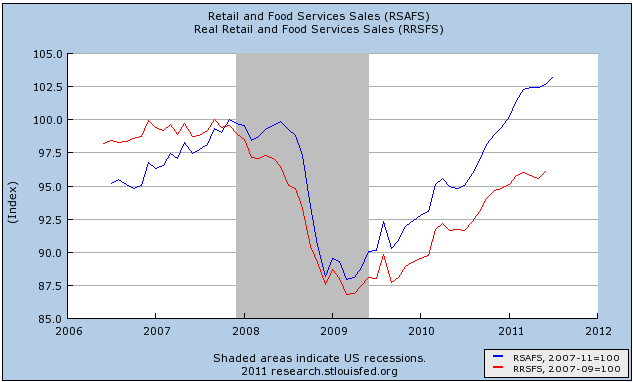
Both nominal and real retail sales continue to improve. Although we don't have the July CPI report yet, it is not expected to come anywhere near the +.5% recorded in July retail sales:
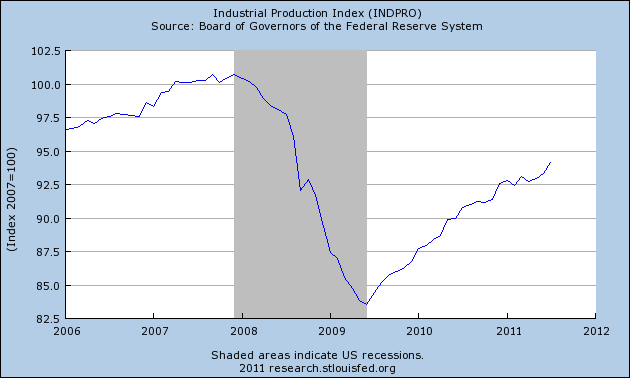
Yesterday's industrial production report of +.9% maintains the solid upward trend of that series:
Finally, aggregate hours (blue) have continued to improve, and also continue to improve relative to payrolls (red):
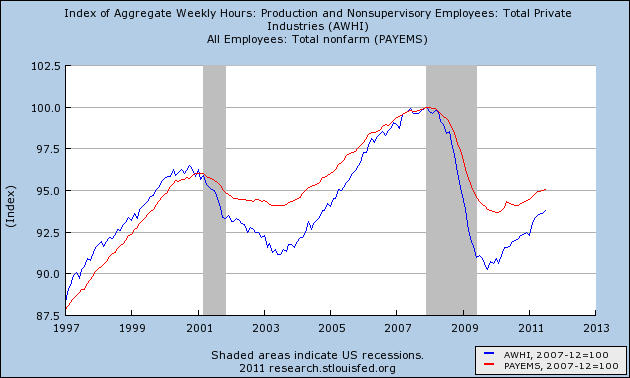
Not one of the 5 series most critical to an NBER determination have turned negative. All 5 are still improving through July.
The 3 long leading indicators
There are 3 series in particular that function best as long leading indicators: housing, the yield curve, and the DJ Bond Index. A recession call gets no help from any of them, either.
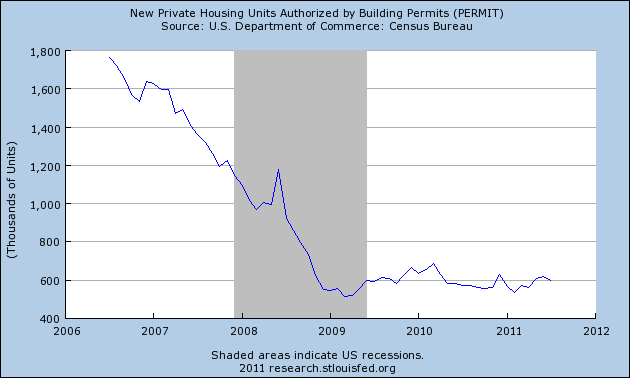
According to Prof. Edward E. Leamer, housing has its biggest effects on the economy 12 to 15 months from a significant change. Here are housing permits for the last 5 years. There was a 75%+ collapse in housing permits between early 2006 and the bottom in 2009. With the help of the US and California housing credits, permits gained over 100,000 over the next year. When the programs ended in spring 2010, housing permits rapidly declined over 100,000, and continued a much slower decline for the rest of the year, before improving to the 600,000 level again very slowly this year. Prof. Leamer's research predicts that the maximum impact of the spring 2010 decline has arrived and is beginning to recede:
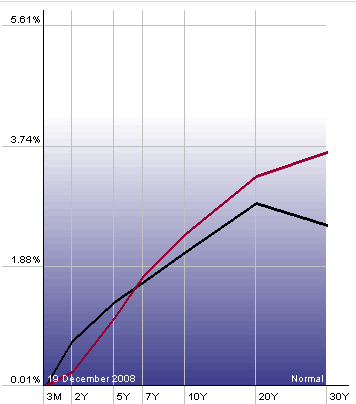
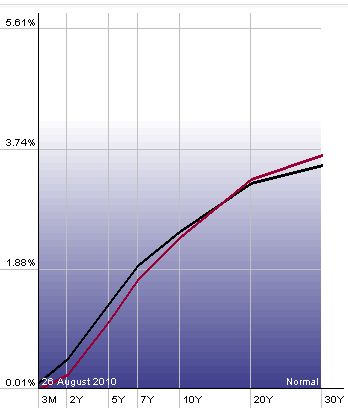
Since the 1950s, the yield curve has been a potent forecasting tool for a period about 1 year later. No recession in the last 50 years has begun without an inverted yield curve in the year prior. This includes the curve inversion of late 2006. In the below two graphs, the present yield curve (red) is compared with its flattest post-2006 reading, in December 2008 (left) and August 2010 (right). We know that within a year of the first reading a recovery was underway, and we know that as of the last revisions, positive GDP continued for at least close to a year after the second. There is no reason to believe the yield curve now is predicting anything worse.
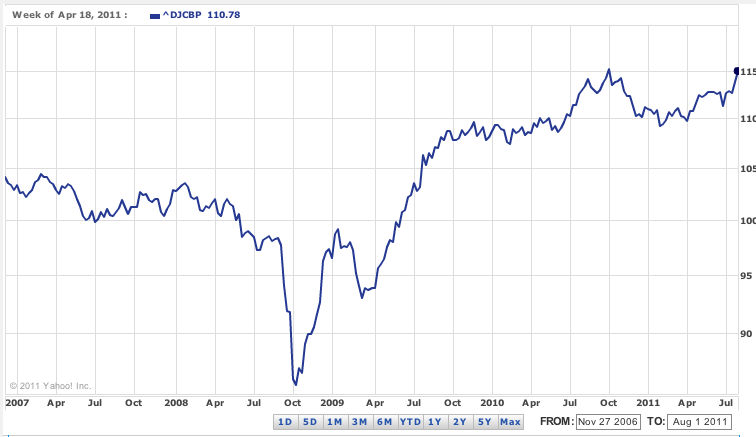
Relying upon the yield curve, however, has come under some justified criticism given the zero bound on Fed interest rates. Indeed, the yield curve did not invert at any time between 1930 and 1954 despite the occurrence of the worst recessions in the last 100 years during that time (it did invert in 1928). In the case of pre-WW2 deflationary recessions, however, the Dow Jones Bond Average had a nearly perfect record, also turning negative about a year before those recessions. Here's what its modern version, the Dow Jones Corporate Bond Index, looks like now - it made a new eight year high last week:
The remaining modern leading indicators:
In all cases in the last 50 years, no recession began until at least 8 of the Leading Economic Indicators were below their levels of 6 month before. Here is a graph (ending in early 2009) of a 6-month diffusion index of the indicators:
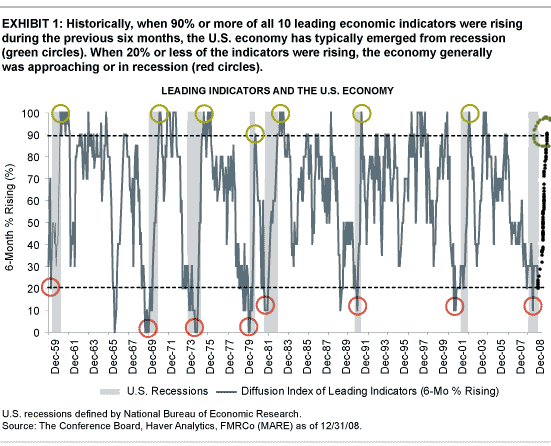
The point of this index is that, to signal recession or recovery, at least 8 or 9 of the 10 indicators should all be moving in the same direction. The present record isn't even close. So far, only 3 -- ISM vendor performance, stock market performance, and consumer expectations -- may be negative for 6 months. Let's look at the evidence in more detail.
No recession in the last 50 years, has occurred without Real M1 (blue) turning negative, and Real M2 (red) being up less than +2.6% YoY. Real M1 has remained relentlessly positive, and after a sustained period under +2.5% YoY, Real M2 has also improved strongly in the last 2 months (in the graph below 2.5% is subtracted from M2):
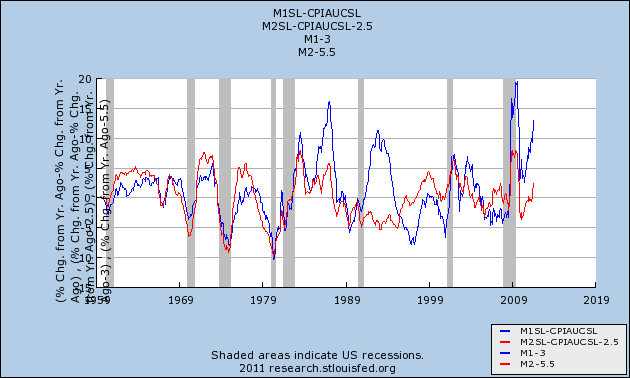
Indeed, either the yield curve inverted, or Real money supply turned negative, before every single recession since 1920.
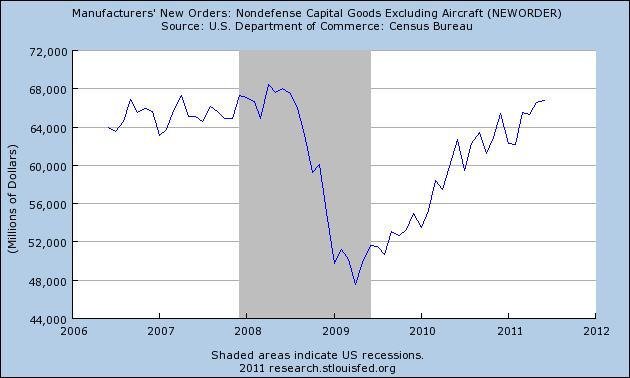
Additionally, "core" new durable goods orders have also continued to improve:
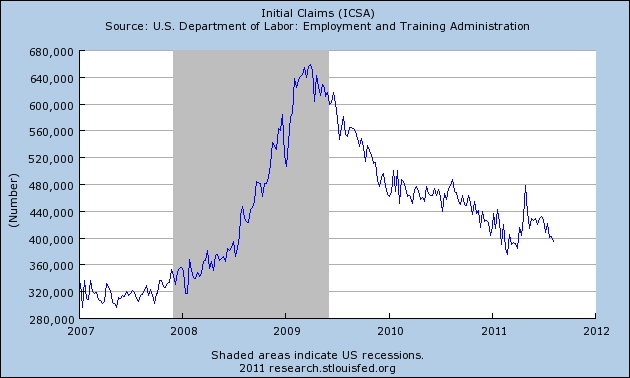
Perhaps more importantly, initial jobless claims, which had turned seriously negative from April through June, have completely reversed, and are approaching their late February - early April lows:
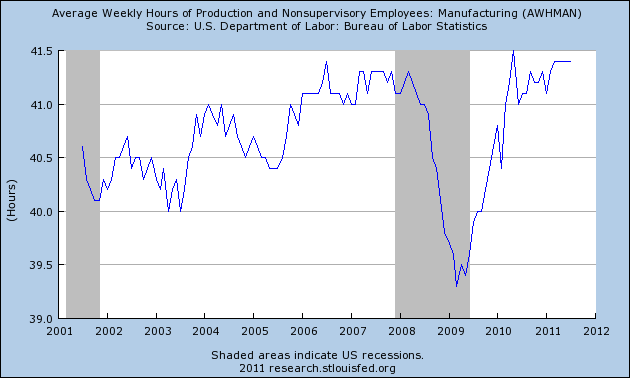
The manufacturing workweek has remained steady for the last 3 months:
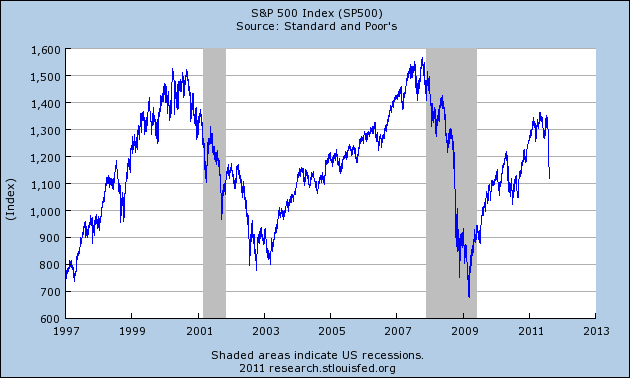
In fact, only 3 of the 10 leading indicators have turned decisively negative, stocks:
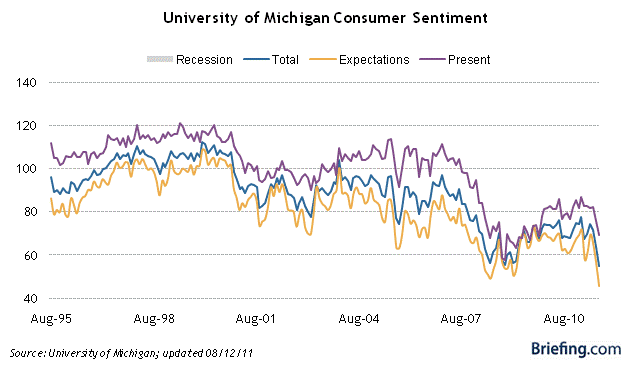
consumer sentiment:
and vendor deliveries in the ISM survey:
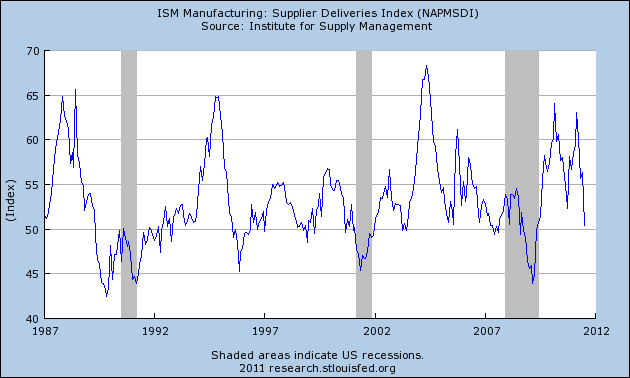
Many regional manufacturing surveys, such as the Empire State survey released yesterday, are similarly negative.
Three out of 10 leading indicators turning negative is not enough to overcome the inference of continued economic expansion from the positive to neutral readings of the other 7.
Other leading indicators in pre-WW2 recessions:
Because both academic economists like Prof. Brad DeLong, and lay observers have voiced skepticism, even "alarm," that economic indicators developed from post-WW2 inflationary recessions, usually brought about by Fed tightening, may not be applicable to deflationary scenarios brought about by asset and credit contraction like the present, during the last several months I tested publicly available economic data series that go back to the 1920s at least.
Additionally, Prof. Geoffrey Moore, the founder of ECRI and the father of modern business cycle research, did publish a manuscript in 1961 discussing at length Leading Indicators for pre-WW2 recessions, available from the NBER via the St. Louis Fed. Indeed, some of his source data went all the way back to 1854. He found that they were valid indicators fir the post WW2 recessions as well. Here is his graph showing the most effective pre-WW2 leading indicators:
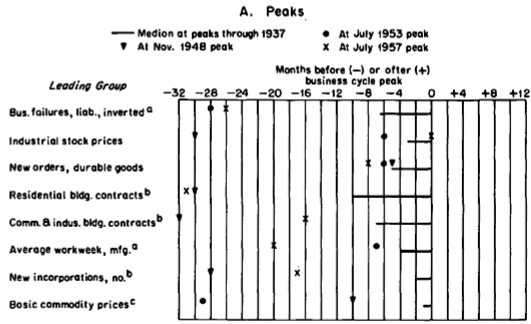
You can see that at least 4 of these are still in use today. Several others, including business failure liabilities and new incorporations, do not seem to be publicly available. Using the JJM ETF as a proxy for industrial commodities, the record is equivocal. After approaching their February 12 month high only 3 weeks ago, commodities have made a new 9 month low this week.
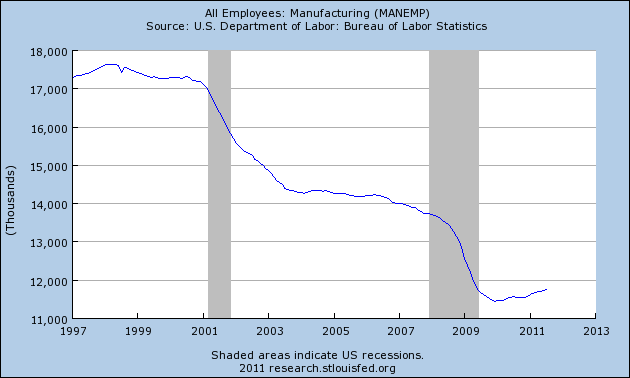
Additionally, another leading indicator he found, though not as effective as those above, was employment in manufacturing. Although there has been a steep secular decline in US manufacturing employment, in the last two years something very counter-trend has happened. Employment in manufacturing has risen, right up through July:
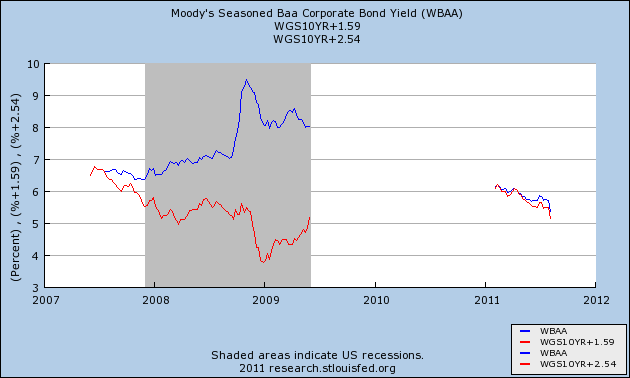
Additionally, another comparison that is available for data going all the way back to the 1920s is that of corporate bonds vs. long term government bonds. As a recession approaches, most usually yields on both decline, but government bonds significantly moreso than BAA grade corporate bonds, which carry more risk. As the recession actually hits, the series typically diverge, as BAA corporate bonds price in expectations of some defaults. This pattern was apparent going into the "great recession." While there was a slight divergence in the last several months, it was not that significant, and in the downdraft in yields last week, it completely disappeared:
The Oil choke collar
Finally, I would be remiss if I did not include a discussion of the Oil choke collar. Every time the price of energy has exceeded 4% of GDP, a recession has occurred. We have breached that level this year:
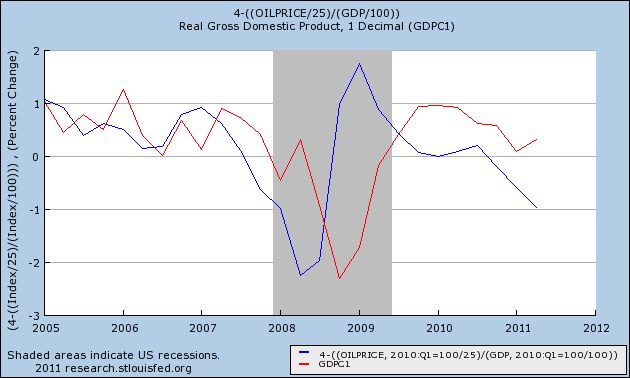
A little explanation is in order. The left scale is set to show the divergence in price from Kopits' inflection point of 4% of GDP. Thus the left scale result, n, equals 4 minus Oil price/GDP. If Oil price =5% of GDP, then N = 4-5= -1. Contrarily, if Oil price = 3% of GDP, then N = 4-3 = +1. Also note that since the graph had to be done quarterly, it does not reflect the decline in Oil prices since June 30 (all the way down to $76 and currently about $86).
As you can see, since the price of Oil approached the inflection point in 2005, it has predicted GDP changes very well. And it does not bode well for revisions to Q2 2011 GDP or the third quarter either.
One important difference, noted by Prof. James Hamilton of UCSD, is that this time around, there has been less of a "shock" since consumers did see these prices 3 years ago. Consumers have thus not over-reacted, as has been demonstrated all year by strongly positive retail sales reports.
Thus, while high energy prices have shown up in some of the stalling data above, they do not necessarily imply a contraction. At least, they have not bled broadly over into other data series as they have before every other oil-induced recession.
Conclusion
There is no doubt that the economy is under serious stress. Manufacturing, which had been leading the recovery, has completely stalled, and in at least a few regions, may actually have contracted slightly. Nervousness about a financial seize-up reminiscent of 2008, and a fundamental loss of confidence in Washington panicked the markets (as well as consumer confidence) in the last several weeks. Oil continues to act as a choke collar on economic growth.
But the simple fact is that the current data does not make out a case that either a double-dip recession has started, or is imminent. Most of the domestic US economic data remains solidly positive.