On Monday personal income, spending, and the savings rate for July were reported. Spending was up 0.4%, while the savings rate declined 0.3%.
Readers already know that for the last 5 years, households have been rebuilding their balance sheets. In April 2005, they saved a paltry 0.8% of earnings. That rocketed as high as 8.2% in May 2009. With the latest reading, personal savings was 5.9%. My position is that the "slow motion bust" won't be over until that balance sheet is fully rebuilt, with a savings rate closer to 10% as it stood in the 1970s and 1980s.
But, in the shorter term, we don't want the balance sheet rebuilt too quickly. When households cut back on spending - out of fear - in order to save, that is Keynes' Paradox of Thrift that throws the economy into a recession. A couple of weeks ago, in How Pavlov's Dogs explain the Sputtering Recovery I argued that it was exactly a case of paralyzing fear that put the economy into a sudden stall beginning at the end of April with the Euro crisis.
The tradeoff between savings and consumer spending is evident in the below graph. Since unfortunately the St. Louis FRED won't allow me to graph the rate of monthly change in the savings rate, the below is the best I can do. In the graph, the savings rate, normed to zero at its highest rate, is shown in blue. The change in retail sales, normed to zero at its lowest change, is shown in red, beginning of 2009.
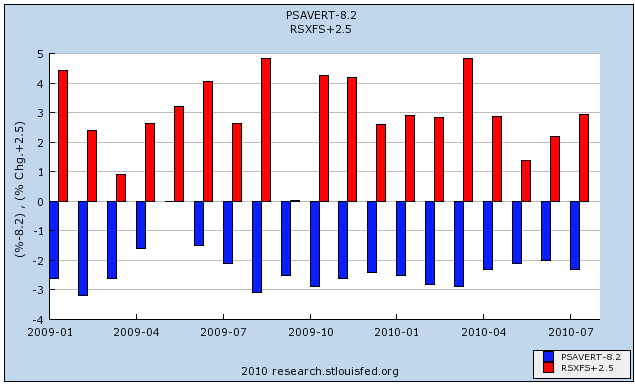
While not exact, the general "mirror image" is clear. When the savings rate decreases (the blue line goes down), the change in retail spending increases (the red line goes up). When savings increase, the change in spending decreases. Note in particular the big increase in the savings rate in April of this year that coincided with a sharp decrease in the rate of retail spending. That was Pavlovian fear kicking in.
In tht regard, even if it is only one month, that consumers were comfortable saving a little less and spending a little more in July is a good sign that their Pavlovian fear may have begun to abate.