The Federal Reserve's report on household debt burdens was released Friday, covering the July-September quarter. According to the bank,
The household debt service ratio (DSR) is an estimate of the ratio of debt payments to disposable personal income. Debt payments consist of the estimated required payments on outstanding mortgage and consumer debt.Both measures declined substantially again, although by not as much as the last few quarters. I've combined them into a single graph:
The financial obligations ratio (FOR) adds automobile lease payments, rental payments on tenant-occupied property, homeowners' insurance, and property tax payments to the debt service ratio.
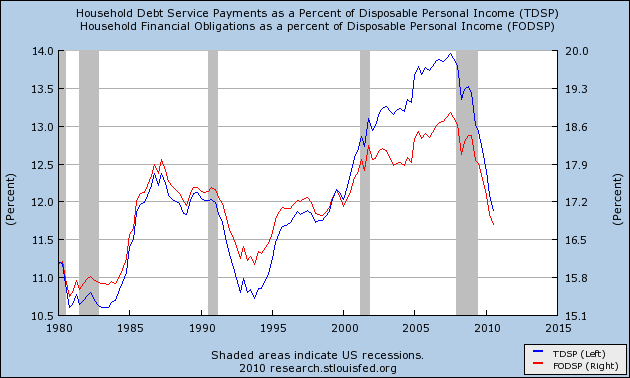
Debt service payments (blue line) are now less than most of the last 30 years. Total financial obligations (red line), are now less than all but the early 1980s and 1990s - i.e., less than more than 2/3's of the last thirty years.
If this rate of decline continues, then by 6 months from now, households will have lower debt burdens than at any time since the early 1980s - in other words, they will be at a 25 year low.
Recently, a few pundits have made the argument that households weren't actually cutting their debt at all, based on bank charge-offs and foreclosures.
This was addressed and appears to have been put to rest by the New York Federal Reserve. The bank's Quarterly Report on Debt and Credit for the third quarter of 2010 showed that
Since its peak in the third quarter of 2008, nearly $1 trillion has been shaved from outstanding consumer debts.The seemingly conflicting data on the relatively modest decline of overall debt, vs. the steep decline in financial obligations, is explained in large part by refinancing. Here is a graph, courtesy of Mortgage News Daily, of the volume of refinancing measured weekly in the past 2 1/2 years:
Additionally, this quarter’s supplemental report addresses for the first time the question of how this decline has been achieved and notes a sharp reversal in household cash flow from debt, indicating a decrease in available funds for consumption. According to newly available data through year end 2009, the payoff of debt by consumers reduced their cash flow by about $150 billion, whereas between 2000 and 2007, borrowing had contributed more than
$300 billion annually to consumers’ cash flow.
Excluding the effects of defaults and charge-offs, available data show that non-mortgage debt fell for the first time since at least 2000. Also, net mortgage debt paydowns, which began in 2008, reached nearly $140 billion by year end 2009. These unique findings suggest that consumers have been actively reducing their debts, and not just by defaulting.
“Consumer debt is declining but only part of the reduction is attributable to defaults and charge-offs,” said Donghoon Lee, senior economist in the Research and Statistics Group at the New York Fed. “Americans are borrowing less and paying off more debt than in the recent past.
There was a surge of refinancing as mortgage rates fell to 4%. Somebody who, for example, had a 6% mortgage, and refinanced at 4%, instantly lowered their mortgage payment by 1/3 - even though the overall debt remained the same. Furthermore, it appears that about 1/3 of all mortgage refinancings during the third quarter included additional paydowns of mortgage balances as well.
When people wonder how we can have both increased saving, and increased spending, this is the answer.