This week's big data had to be the very strong retail sales number on Monday, the 4th positive number in a row. Retail sales for the last 4 months have been growing at an annualized rate of 10%, which may be helping jobless claims, which dropped to their lowest 4 week average in over two years. Housing permits and starts declined, but were within their flat range for the last 20+ months. The good Philly Fed index balanced last week's poor Empire State index, but Induystrial Production and Capacity Utilization flatlined. Leading Indicators were up .5, and last month's number was also revised to a +.5.
Here is this week's high frequency data:
The price of a barrel of Oil fell to about $82 a barrel. But Gas at the pump rose to $2.89 a gallon. If gasoline goes over $3/gallon, I expect consumers will react, and not in a positive way. Gasoline usage declined compared with last year, 8.952 vs. 9.015. Gasoline stocks have plummeted right back into their normal range for this time of year. Over the longer term, gasoline usage has remained about 6% below its rate from the first half of the past decade.
Meanwhile the Mortgage Bankers' Association reported that its seasonally adjusted Purchase Index decreased 5.0% last week, taking back the gain of the prior week.Purchase applications have stabilized generally in the last few months at a level about 20% lower than 2009. Meanwhile, the Refinance Index decreased 18.5% from the previous week, reacting sharply to higher mortgage rates.
The ICSC reported same store sales for the week ending November 13 decreased =0.1% week over week, but for the ssecond week in a row increased 3.4% YoY, the best comparison in several months. Shoppertrak once again did not report for the week, but did report that sales have been up 3.2% for the last six weeks compared with the same period in 2009.
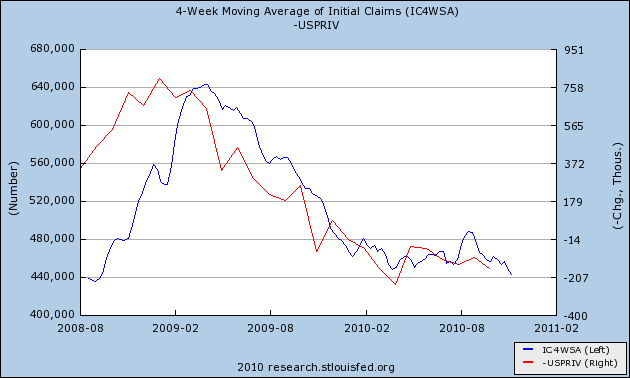
The BLS reported 437,000 new claims, the third week in the last four that claims have broken out under 440,000, resulting in t he lowest 4 week moving average in over 2 years.
Railfax for the second week in a row showed outright decline in the advance over last year's loads for all sectors. As I indicated last week, some of this may be due to retailers ordering and receiving holiday goods early, after last year some were left without merchandise due to shipping delays, but we will see.
The American Staffing Association failed to report this week. Obviously the temp they hired to prepare the report failed to show up.
This week M1 is all about Quantitative Easing. It increased 5.0% in the last week alone (!), and is up 5.5% month over month and 12.5% YoY, hence “real M1” is up 11.3%. M2 increased .2% last week, +0.4% month over month, and 3.1% YoY, so “real M2” is up 1.9%. Real M2 had been up about 2.2% in the last few weeks so this is a slight setback.
Weekly BAA commercial bond rates increased 0.15% last week to 5.95%. This compares with yields on 10 year bonds up +.07%. There is a small degree of stress in this comparative movement.
The Daily Treasury Statement showed $91.5 B in receipts vs. $85.8 B a year ago, a gain of about 6.5% for the first 12 days of November. For the last 20 days, receipts are up $132.7 B vs. $125.7 B a year ago, a gain of about 5.7%. Seasonality is beng felt in these November numbers, which also mark the first time that we are comparing YoY with an advance from the recession bottom in withholding.
The LEI, retail sales, and initial jobless claims all tell us that not only is the dreaded double-dip not making an appearance, but a re-energized recovery may show increasing job creation as well, as to which I offer you the following (hopefully) thought-provoking graph, showing initial jobless claims in blue, left scale, and private nonfarm payrolls, inverted, in red, right scale :

We'll see in a couple of weeks.
I will be enjoying some of this year's vintage this weekend, and I wish everybody else an enjoyable weekend as well..