Introduction. Now that Jobs have bottomed, the question becomes, how quickly do they return?
In the last couple of weeks, we have gotten some economic data that is so strong it is almost scary. For example, just yesterday March Leading Economic Indicators were reported up 1.4%, meaning for the last 12 months the LEI are up ~12%! This is the strongest reading in two decades:
This implies a much stronger Recovery than either of the two "jobless recoveries" of 1992-3 or 2002-3.
Last week, retail sales were reported up 1.6% including autos due in large part to Toyota's rebates (blue line), and up 0.6% ex-autos (red line). This accelerates the return of the consumer since the bottom a year ago:
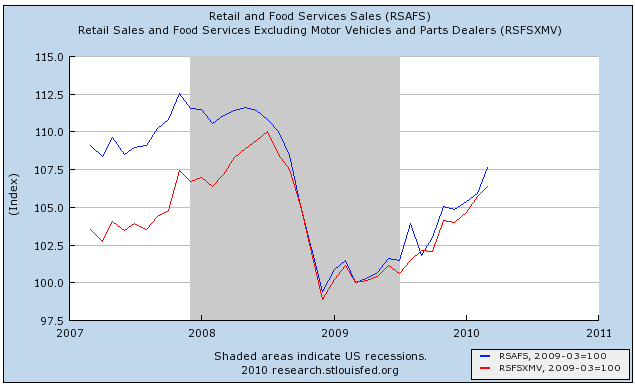
Since the consumer is 2/3 of the economy, and consumer spending is necessary for job growth, in the past I have pointed out just how important retail sales adjusted for inflation (a/k/a real retail sales) are. With the strong showing last week, there are major implications for job growth for the rest of this year, and that is what i discuss in this diary.
I. More than any other economic indicator, real retail sales have over the long run tracked consistently with payrolls
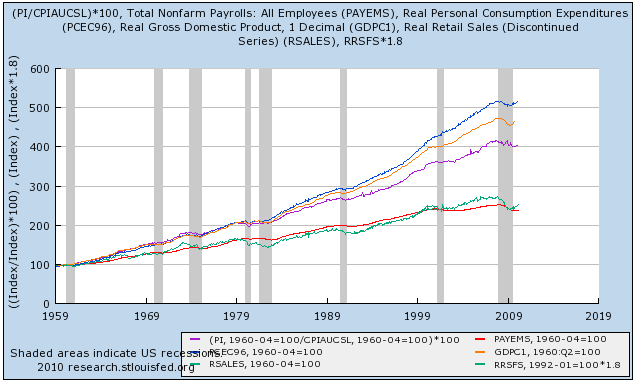
It is certainly true that any number of economic series have a correlation with payroll gains and losses. But none of them -- not GDP, not personal consumption, not person income, nor others -- over the long term tracks so closely with payroll growth. This first graph tracks real GDP (blue), real personal consumption (yellow), real personal income (purple), and real retail sales (green), along with jobs (red) since 1959, a period of over 40 years. It is easy to see that the red and blue lines track very close to one another, while over time the other three (GDP, consumption, income) all outpace job growth.
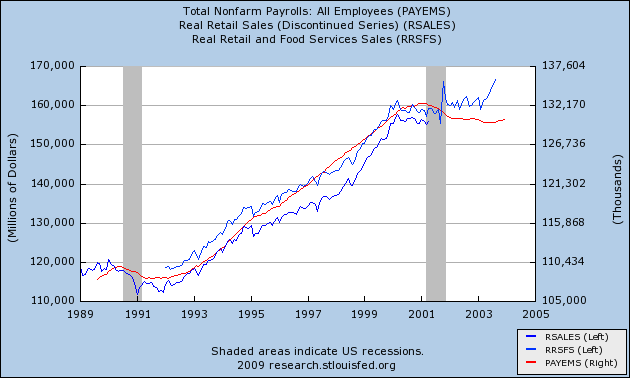
This second graph zooms in on the last 10 years. For a while, retail sales did diverge (demonstrating the impact of the "house ATM" or home equity extractions during the housing bubble).
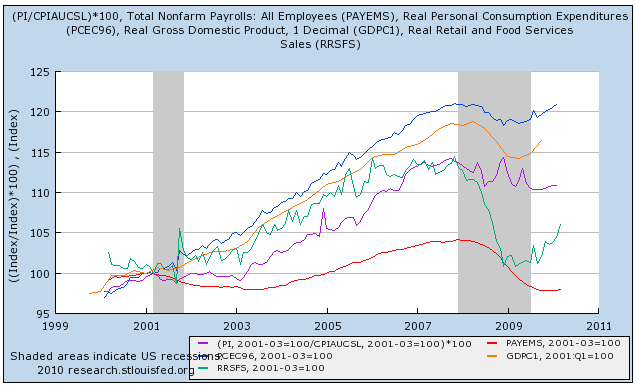
But it alone has come back to earth, once again tracking the long term (lack of) growth in payrolls during the last decade.
In the past I have looked at GDP and compared it with payroll growth, noting that YoY percentage changes in GDP (minus two percent) appears to lead payroll growth:
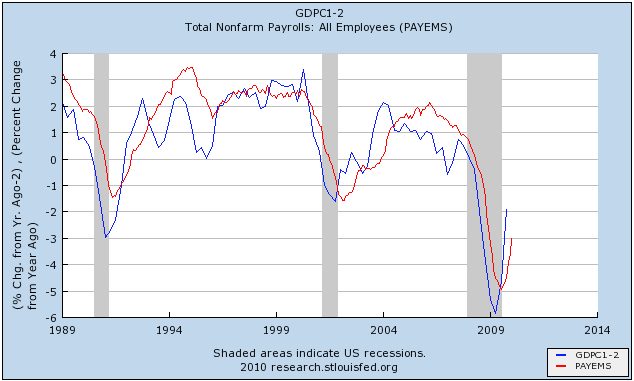
The problem is that GDP is only reported quarterly, so by the time you learn the GDP for a quarter (like Q1 2010, you already know what the payroll growth was. At best, YoY GDP when initially reported, can give guidance about payroll growth over the next couple of months.
Similarly, Personal income (blue line below) seems to correlate well, but unfortunately as this graph shows it is not a leading indicator for jobs (red line) but only a coincident one -- the peaks and troughs occur simultaneiously:
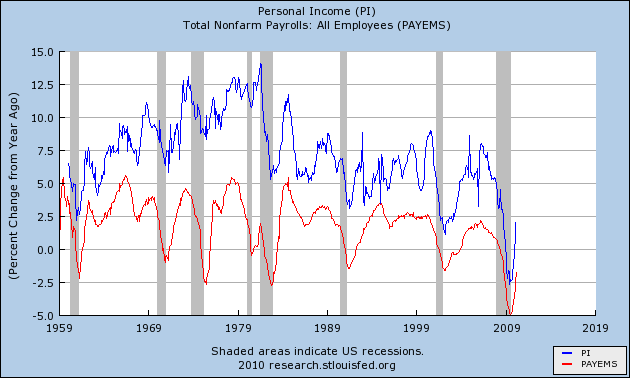
In other words, it can confirm an already-reported jobs number, but cannot help us look at the future trend of job growth.
II. Real Retail Sales is the "Holy Grail" of Leading Indicators for Jobs
To the contrary, not only do real retail sales correlate closely with payrolls over the long term, but they are the "Holy Grail", consistently leading turns inthe job market. Here let me repeat something I have said in several prior diaries.
Contrary to the commonly held belief, historically it has not been the case that job growth leads to consumption. Rather, it is the other way around. Consumer spending typically leads jobs with a lag of about 5 months. Here is a graph showing that point as an average of all post-World War 2 recessions (0 = the month a recession ends):
Real retail sales (that is, retail sales adjusted for inflation) are the "Holy Grail" of Leading Indicators for job growth. They have consistently turned at both tops and bottoms, an average of 3-5 months before job growth or losses turned. Depending on the revisions to February's jobs report, and when the NBER decides to date the end of the Recession, this time around real retail sales, smoothed on a 3 month basis, bottomed either 8 or 10 months before jobs bottomed, longer than usual but not nearly with so much a lag as in the 2002-03 "jobless recovery."
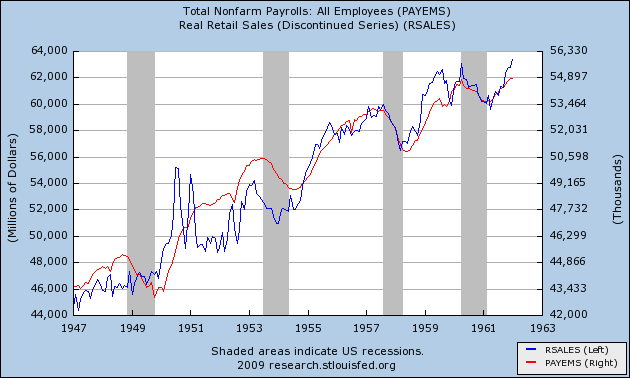
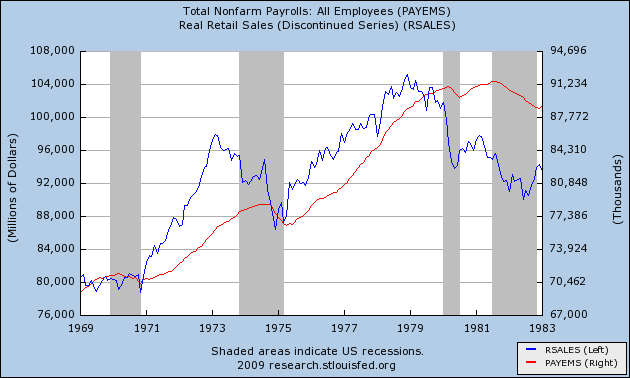
In order to show you this relationship in the most comprehensive way, I am reproducing here graphs showing the entire 60 year record of real retail sales compared with jobs. With the sole exception of the 1961 recession, Real retail sales (the blue line) has consistently made peaks and troughs ahead of payrolls (the red line) ...
in the postwar period from 1948 through the 1962:
as it did during the 1970s recessions (ex the 1970 trough):
as it did during the 1991 and 2001 recessions and "jobless recoveries":
as it has just done with regard to the "Great Recession:"
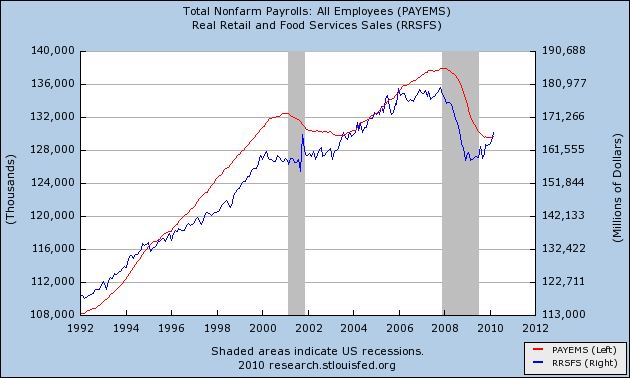
Needless to say, this last graph strongly implies that, now that we have turned the corner and actually added 114,000 jobs in March, we will continue to have job growth.
III. Real retail sales suggest that we will have strong job growth for the remainder of this year.
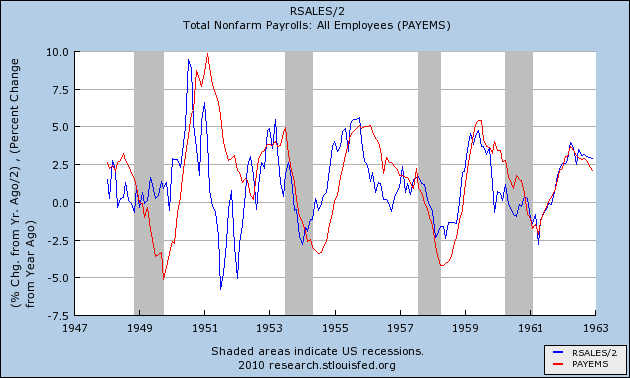
But how much? For that, let's examine another way of looking at the relationship between real retail sales and jobs; namely, to graph the year-over-year percentage changes in each. That is what the next series of graphs show. Because real retail sales are historically much more volatile, these graphs take the YoY percentage change in real retail sales and divide by 2 (blue line), which historically yields a very close fit with YoY payroll changes (red line).
Here it is for the immediate postwar period:
And here it is for the 1970s recessions and recoveries:
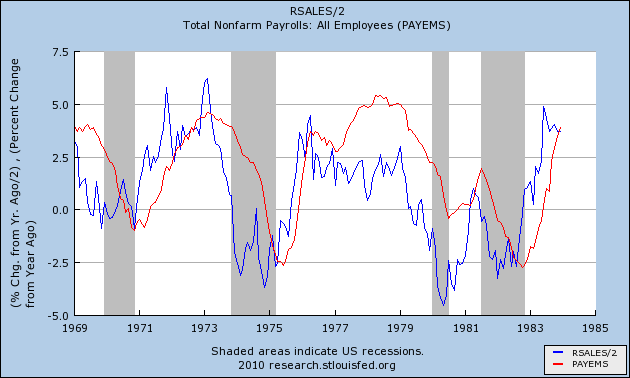
And here it is for the two "jobless recoveries" and up until now:
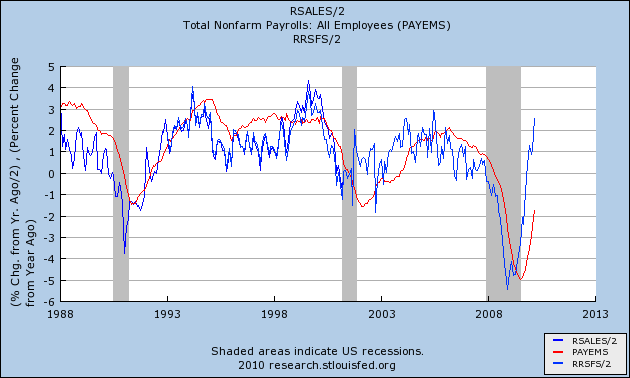
Notice that the blue line turns both up and down first, before the red line. Also notice that the amplitude of the changes is usually very similar.
In fact, the weakest relationship by far occurred during the lame "Bush expansion." Real retail sales only went up more than 5% YoY (translating to 2.5% on our graph) for 4 months during that entire time: February and March 2004 and June and July 2006. It took 12 months thereafter for YoY job growth to peak at 1.7%. If our recovery winds up being as week as the Bush expansion, that would mean 2 million jobs added within the next 12 months, or an average of 165,000+ jobs a month.
On the contrary, following the deep 1974 recession, job growth lagged real retail sales in percentage terms by about 4-5 months. Following the severe 1982 recession, there was an average 8 to 9 month lag. In others, such as the 1992 recovery, there was only a 3 to 4month lag.
With regard to the "Great Recession", in percentage terms, real retail sales had their worst YoY decline in December 2008. Payrolls had their worst YoY percentage decline 6 months later, in June 2009. In the months since June, the YoY percentage of job losses/gains has continued to lag the YoY percentage losses/gains of retail sales by a median 6 months . If that relationship were to continue for the remainder of this year, then there would be 2.5% YoY job growth by September 2010, which translates into an average of almost 500,000 jobs gained for each of the next 6 months!!!
But let's be more conservative, and figure that, while this jobs recovery will be more robust than the awful "Bush expansion," it will not continue to be so V-shaped in percentage terms as it appears now. If we figure instead that the economy will grow by 2.0% jobs (not 2.5%) YoY by the end of this year (i.e., a 9 month rather than a 6 month lag), that means that in 2010, 2.5 million jobs will be added to the economy. Three months in, only 114,000 non-census jobs have been added. That means that beginning this month, the next nine months would average 250,000+ jobs a month, to grow the remaining 2.4 million. In comparison, that didn't happen until 1993 following the 1990 recession, and only happened at all sporadically during 2004-06 during the last decade.
Very few people have been calling for a job recovery that strong. It even gives me pause. And yet, that is what the data suggests, and so that is what I am reporting to you.