This is the Fourth of (now) Six posts exploring leading indicators for job growth in the economy. So far I have examined:
(1) initial jobless claims, which have until now been declining gradually, and which at their trend rate must decline at least 3 more months before they would get to the point where jobs would be created;
(2) the ISM manufacturing employment data, which is very strong and suggests the jobs could be added to the economy next month, and even possibly now;
(3) Industrial Production, which even moreso than ISM manufacturing, is suggesting that job growth could happen imminently - but has a very short lead time; and
(4) duration of Unemployment, which appears to be of only limited value, to confirm a payroll reading afterward.
But today, I'm going to talk about "the Holy Grail", that leading indicator which generally and reliably gives advance notice of when job growth will occur. It is exactly counterintuitive, and I found it while looking for an series I thought would be most likely to show that job growth isn't anywhere close to happening.
We like to think that jobs must lead consumer spending. For example, Barry Ritholtz's Big Picture blog featured a cartoon based on that very idea within the last week. It is a commonplace to read on economics blogs that, because there is no job growth, consumer spending will continue to suffer. In fact, 60 years of data shows exactly the reverese! It is real retail sales which lead the creation or loss of jobs some months into the future. It is a consistent relationship with almost no exceptions. And it is a significantly leading indicator. So I am going to show you the entire series via graphs:
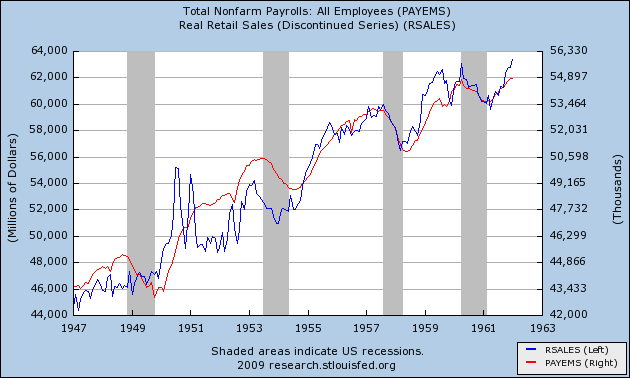
Here is the postwar period from 1948 through 1962. With the sole exception of the 1961 recession, Real retail sales (the blue line) consistently peaks and troughs ahead of payrolls (the red line):
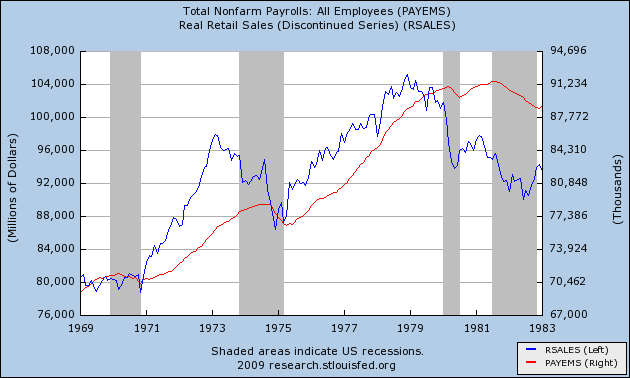
as it does during the 1970s recessions:
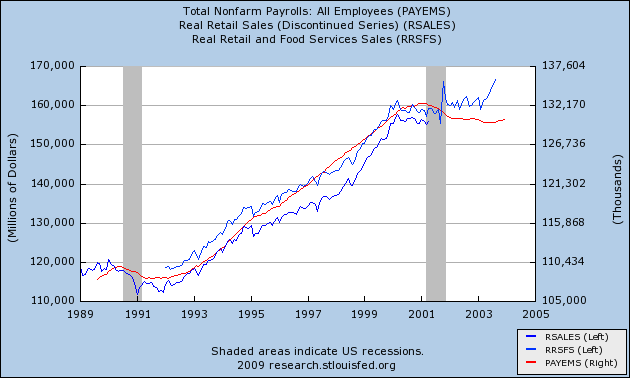
as it does during the 1991 and 2001 recessions and "jobless recoveries":
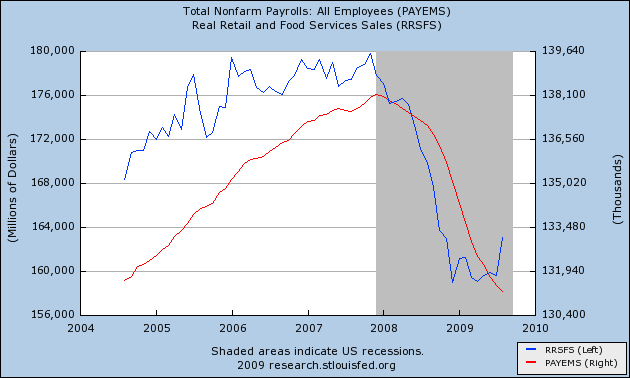
as it has done now:
In addition to the 1961 recession, the only other two times in which Real retail sales did not lead were the 1948 peak and the 1970 trough.
In fact, real retail sales has over the last 60 years peaked a median +5 months ahead of jobs, with the following variance: (-4, -3, 0, +1, +4, +5, +5, +11, +14, +16, +17).
It has also troughed a median +5 months ahead of jobs, with the following variance: (-2, 0, +2, +3, +4, +6, +6, +7, +9, +23). Note that the bottoms are more regular and close in time than the peaks -- peaks tend to be long sprawling affairs whereas most bottoms have been "v" shaped. I will discuss the outlier -- the 2002-3 recovery -- in some detail in part Five.
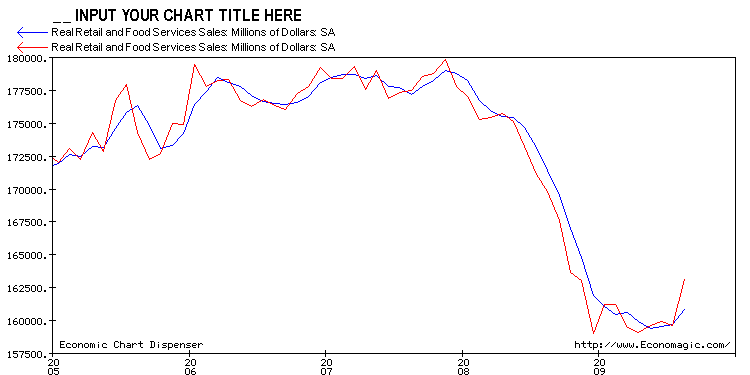
Because real retail series is a "noisy" series, it helps to smooth the data over 3 months. But doing so only moves all but one of the peaks and two of the troughs a grand total of 1 month, and the median lead time for peaks remains the same at +5. The median lead time at troughs becomes even tighter, shortening to +3.5 months.
As it happens, our own episode is one of the two episodes where smoothing the real retail sales data moves the trough, from December 2008 to April 2009. Here is the graph showing that difference, courtesy of Economagic:
What separates the cluster of entries nearer the median from the outliers is, as with Industrial Production, the strength of the move. Flat moves in real retail sales generate a lot of noise, and a longer period between the turn in sales and payrolls. Strong moves in sales generate reliable subsequent moves in payrolls within 8 months after the turn. In general, with regard to recoveries, an increase of about +2.5% a year is necessary to reliably generate a subsequent move in real retail sales.
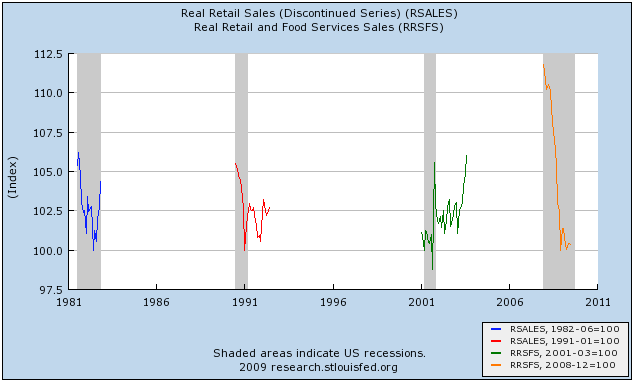
[note that the above graph does not include this past week's 2%+ growth in real retail sales, which gives ~2.5% growth.]
This was even true of the 2002-3 "jobless recovery." When real retail sales briefly grew at about 2.5% in the first six months of 2002, in July 2002 for the first time, the economy added jobs. When real retail sales thereafter stalled again, jobs were slowly lost again.
Translating that into our recession/recovery so far, an increase from the 3-month average bottom at $159.4 million, means a move to $163.4 million. As of August's number, reported on Tuesday, the three month average is $160.9 million, a gain of 0.9%, not nearly enough of an increase yet to generate a positive jobs number.
There is much more that can be done by using Real Retail Sales as "the Holy Grail." In part Five I will discuss how it can be used in conjunction witht the other series already described to better pinpoint when job growth is likely to occur. Finally, in Part Six, I will show how it can be used to forecast the peak in Unemployment.