Another BLS employment report, another negative number. At least for February the -36,000 reported job losses were much better than feared due to blizzard. Back out census hiring and the loss was a little worse, at -51,000. Virtually the entire loss can be blamed on construction workers, both residential and commercial, as well as government employees -- the laggards as I expected per my comments earlier this week. Unemployment remained steady at 9.7%. Average hours worked declined slightly, including manufacturing hours. I haven't crunched the numbers yet, but I suspect we are going to have the first negative LEI in almost a year when February is reported.
Other monthly measures of jobs all were better. The household survey turned higher for the 2nd month in a row. It looks like December was the bottom in that survey, which is now at a 5 month high. The ADP report at -20,000 was tied for smallest preliminary loss since the recession began. The Challenger report was also the best in well over a year. Best of all were both ISM indexes which were consistent with actual job growth in both areas, most likely starting next month.
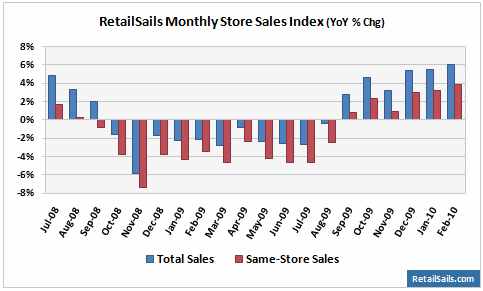
In other news, Retail Sails reported that "Preliminary results show total sales increased 6.0% from a year ago to $28.9 billion for the 30 retailers we track, while same-store sales were up 3.9% compared to a 3.4% drop in the year-ago period."
While the "same store sales" number could be subject to survivor bias, the total sales number probably isn't -- since defunct retailers simply contribute zero.
If general retail sales for February are shaping up decently, car sales dropped to a 5 month low:
2009-12-01 11.201
2010-01-01 10.769
2010-02-01 10.340
This month's car number is also subject to a lot of wiggle room, since buyers would presumably like to stop, as well as drive, new Toyotas. It appears that most prospective Toyota buyers are simply waiting, rather than buy a different brand.
Turning to high-frequency weekly numbers, same store sales for the week of February 27 were up +0.7% YoY and down -0.8% WoW. The 4 week average for February is +0.7% YOY. Shoppertrak reported a much stronger, +4.3% YoY number for retail sales for the week.
Rail traffic showed improvement YoY and comparatively with last week on all indexes. Baseline traffic, however, while improving is still slightly below last year. The culprit seems to be coal. Should we blame it on global warming?
The BLS new jobless claims report decreased to 469,000. The 4 week average also decreased slightly to 471,000.
The E.I.A. reported gas sales once again slightly under last year's, and gas prices rose again to $2.70/gallon. At week's end, a barrel of Oil traded for just under $82.00. Oil's long slow uptrend from last summer is intact, and we look on course to hit the critical $90/barrel or $3/gallon figure in a few months. This is my biggest concern for later this year.
Daily withholding taxes continued to improve. On March 3, 2010, $36.5B had been collected so far this month, vs. $36.2B for the first 3 days of March last year, so we are starting out the month ahead of last year. February finished -2.3% below last year.
Because the same date may fall on a weekday vs. weekend YoY, I am also going to start tracking the 20 day moving average of withholding tax receipts. For the last 4 weeks, $131.9B has been paid this year, vs. $134.7B last year, for a decline of -2.1%.
Withholding tax receipts by month since October are as follows:
Oct. $124.7B -12.8% YoY
Nov. $127.7B -8.8% YoY
Dec. $154.9B - 7.6% YoY
Jan. $140.0B -6.7% YoY
Feb. $ 139.6B -2.3% YoY
And now, this week's special weekend bonus feature ...
The below photo shows something that everybody should see at some point, on their "Bucket List" so to speak. Your mission is to figure out what this is:

Have a very nice weekend and I will give the answer next Friday!
Update: Well I've been busted because apparently y'all can read my file name for the photo!
If you haven't seen it, you should. Until last year, you could stand more or less right next to the glow -- until the hole opened up!