Since it is a little bit of a slow economic news week, I wanted to share something that I've noticed but haven't had the time to fully explore yet. The specific trigger for this post is Bonddad's entry Friday taking A Closer Look at Initial Unemployment Claims, in which he noted that
initial jobless claims above 400,000 is not fatal to a recovery. But, a continuing period over 400,000 is probably confirmation of a "jobless" recovery.Of course, in the past I have noted that actual job growth began at the level of 500,000 initial claims in recoveries from the 1970s and 1982 recessions -- although that was not the case in the 1992 and 2002 recoveries.
Here's what has been on my mind. Although it doesn't make any rational sense to me whatsoever, even though Initial Claims are a "leading indicator" and nonfarm payrolls are the quintessential "coincident indicator," the fact is that payrolls (jobs) have generally peaked and troughed before Initial Jobless Claims. The troughs are easy to notice, while the peaks tend to be broad and sprawling affairs.
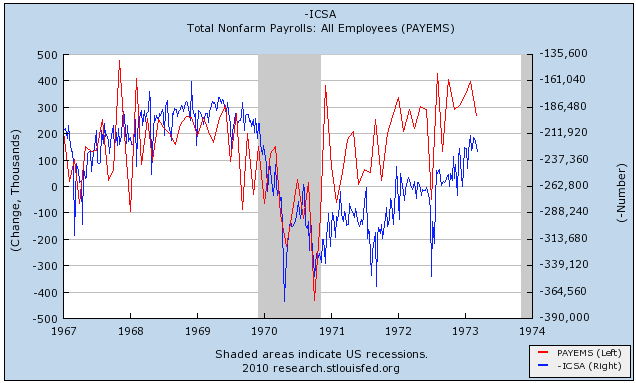
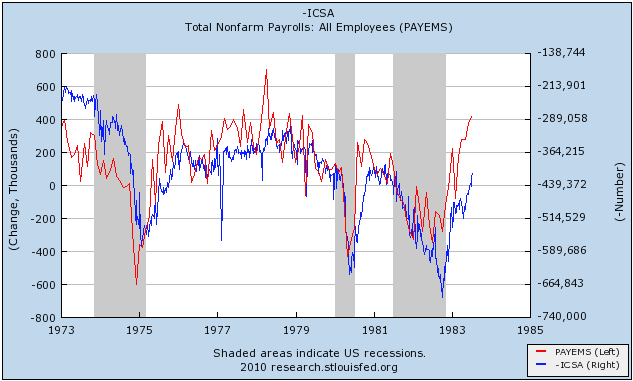
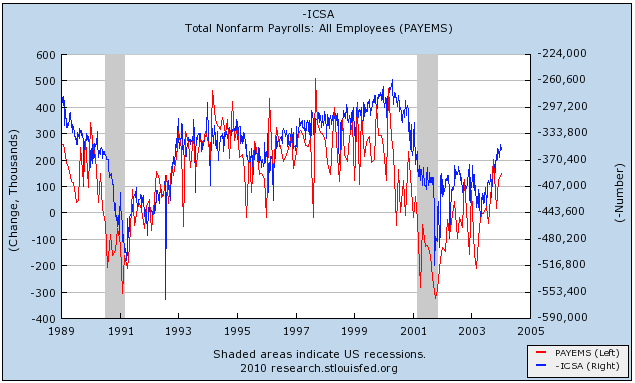
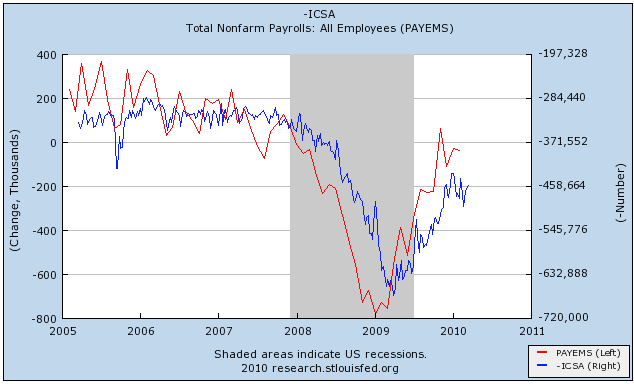
While we have payrolls data back to the Second World War, Jobless Claims data started in the 1960's. Here is the entire 45 year history in 4 graphs, with (courtesy of the St. Louis Fred's new toy) initial jobless claims inverted:

Payrolls peaked in 1967, inverted Initial jobless claims in 1968. The same pattern plays out in 1972 vs. 1973. The 1970 recession is the only one in which jobless claims reached their maximum before payroll losses.

Job losses reached their maximum in the 1974, 1980, and 1981-2 recessions before initial jobless claims. Job gains also peaked before inverted initial jobless claims following the recessions.

Job losses peaked before initial claims in the 1991 recession, and coincidentally in the 2001 recession. Job gains plateaued before inverted initial claims peaked in the 1990s expansion.

During the Bushco expansion, once again payroll gains peaked first. They troughed last January, about three months before the trough in inverted jobless claims.
What seems just as interesting, although I haven't had the chance to explore it fully, is that payrolls also appear to anticipate jobless claims slightly for meso-sized moves during recoveries and slowdowns. Month-to-month payroll data is much noisier than jobless claims data, but in the last year the pattern seems to be holding (emphasis at this point on the word seems) .
Like I said at the outset, we all know that initial jobless claims are one of the 10 "leading indicators" and that nonfarm payrolls is the quintessential "coincident indicator," and yet the graphs don't lie.
So, is the fade of initial claims from the overdone December-January seasonal adjustment, to almost 500,000 new claims a few weeks ago, follwed by improvement to 460,000 last week a prelude to a stall in payrolls data? Or are the current initial jobless claims numbers simply the echo of the November surge in payrolls, followed by the poor December number and the middle-ish January and February payrolls data?