Two of the most important statistics concerning the health of the household balance sheet were released with little fanfare last Friday. They don't lead, and they are reported for the last quarter (in this case, the 4th quarter of 2009), so there is unfortunately a considerable lag, but they are nevertheless quite valuable. These are the ratios of household debt service (blue) and total financial obligations (red) to disposable personal income:

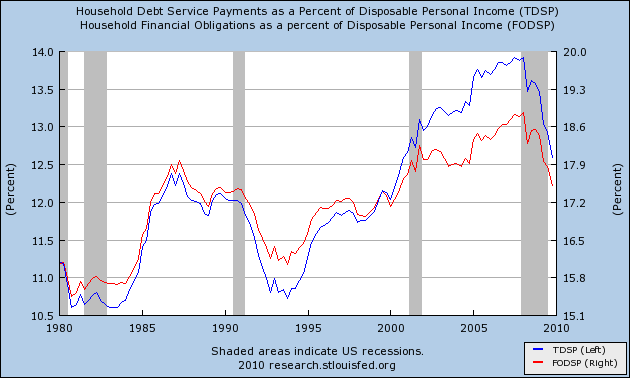
Both continued their steep decline at the end of 2009. Debt service, at 12.60% of disposable income, and total financial obligations, at 17.51%, are at the lowest level since the second half of 2000.
If the trend continues, then by the end of this year, household obligations will be well into the midrange for the 1980s and 1990s. In other words, households will be in much better shape to purchase goods and services than they have been in a long time. This bodes well for the economy going forward in 2011 and beyond.


3 comments:
Is there anything seasonal about these statistics? The reason I ask is because to me it would make sense that household debt would increase in the 4th quarter in the lead up to Christmas, but then go down the following quarter as people start getting their tax refunds.
I don't know the answer, and was just wondering if you did.
Household debt obligations for renters have been decent over the past decade. It's household debt obligations for homeowners which is the problem, and that is much closer to the peak than to the year 2000 level.
http://www.federalreserve.gov/Releases/housedebt/
Also note that household debt obligations may plateau or conceivably even go higher later this year as the next wave of mortgage resets makes payments for millions go higher.
DustinM: No I don't believe they are seasonally adjusted. Since we are dealing with revolving debt, I suspect the factors you mention would not impact the figures significantly.
Anon 8:49 - I have to disagree in part, based on the data in your link.
Renter obligations, with the exception of the time before and during the 2001 recession, have remained between 23% and 26% for 30 years, and are in the middle of that range now.
But homeowner obligations were about 15% in 2000, and 17.59% at the onset of the recession at the beginning of 2008. They are at 16.08% now, so are actually closer to their level in 2000.
Post a Comment