As Bonddad pointed out a couple of days ago, Consumer Credit is up:

This brought to mind something I wrote 6 months ago:
One of the gloomy meme's du jour for the last few days has been how the record year-over-year post-WW2 drop in consumer credit presages worse times ahead. For example, the King of All Doomers had said:
Today, consumer credit contracted at a pace that is shockingly twice as bad as March, even though the March contraction was the biggest drop since 1990....
Now, I haven't heard any update on that from the Doomers in the last week, have you?
Here was my response then:
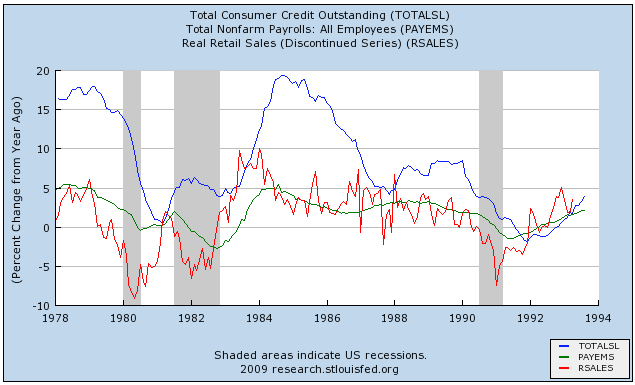
There's just one small problem with that analysis. Consumer credit is a totally reliable lagging indicator. Here's a couple of graphs showing the relationship among 3 data series: real retail sales (red), jobs (green), and consumer credit (blue). I have graphed in year-over-year terms to better show the trend, so this is the "first derivative" of the "real" numbers -- but the general relationship holds for the "actual" numbers as well. Notice the order in which each series turns.Here's the 1980s and 1991 recessions:
and here is the then-current data for the "Great Recession":
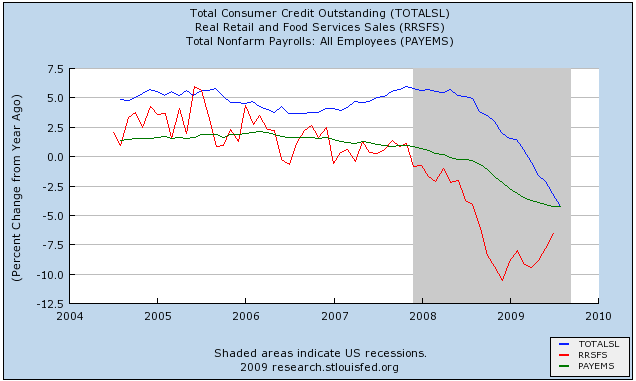
I continued:
The order is unmistakably clear (and it goes back as far as the data has been kept);Here is the same graph, updated through January's data, reported last Friday (green and red lines from the above graph are reversed):
1. First, real retail sales turn (red).
2. Then, jobs turn (green).
3. Finally, about a year after real retail sales turn, consumer credit turns (blue).
Real retail sales turned in December 2008.
Jobs are turning now.
Consumer credit will probably turn in about December.
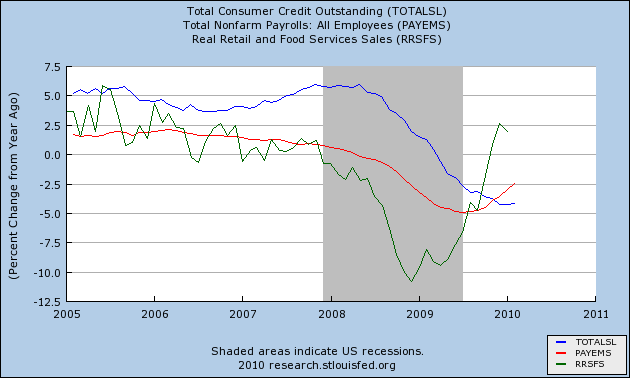
The updated graph shows that:
1. First, real retail sales turned.
2. Then, jobs turned.
3. Consumer credit bottomed in December and turned positive in January. Just as I said it would.
You're reading the right blog.