- by New Deal Democrat
Back in the gloomy days of last December, I wrote that an Obama economic recovery was possible in the second half of 2009:
Elections have consequences ....[A] new Administration in Washington populated by Economic Adults may ..[appreciate the]... pressing need for massive infrastructure investments that can lead to renewed bank lending and economic expansion on Main Street.
Eight months later, I am ready to say, that day has come. As Paul Krugman said earlier this week, "almost for sure the business cycle leading committee will eventually decide the recession ended this summer." This recession is over.
Most economic observers just project past trends - usually based on data that is coincident or lags the general economy - into the future, and so they miss important turning points. In short, they get it wrong. Even now, many are simply reporting the poor recent trajectories of data between 2008 and 2009 (exactly as could have been done at the end of the 1974 and 1982 recessions), and projecting that there is still an ongoing decline that will continue, or else picking through almost relentlessly positive economic reports looking for a negative number of some subset to grasp onto. There clearly are some nasty negative numbers out there. Jobs are still being lost and wage increases have become almost non-existent. International trade as reflected by the Baltic Dry Index and the LA and Long Beach ports data is negative. States and municipalities are still facing declines in tax revenues -- although the year-over-year comparisons are getting less negative.
What pundits miss is, there is a economic cycles run in a typical order including both expansions and recessions, as demonstrated by Prof. Edward Leamer:
The temporal ordering of the spending weakness is: residential investment, consumer durables, consumer nondurables and consumer services before the recession, and then, once the recession officially commences, business spending on the short-lived assets, equipment and software, and, last, business spending on the long-lived assets, offices and factories. The ordering of the recovery is exactly the same.
In fact, many aspects of the economy have stabilized. Many more have actually turned positive, including the most forward-looking aspects listed by Prof. Leamer above.
I.
As Bonddad and I pointed out three months ago, the best way to look into the economic future is usually just to look at the Conference Board's Index of Leading Economic Indicators, which are: real money supply, average weekly manufacturing hours, interest rate spread, manufacturers' new orders for consumer goods, supplier deliveries, stock prices, consumer expectations, building permits, average weekly initial claims for unemployment insurance, and manufacturers' new orders for durable goods.
Ours was a decidedly minority opinion that the worst of the decline had probably already occurred. We noted that as of April 8 of those 10 LEI's had turned positive or at least neutral. Three months later, that trend has been reinforced. the LEI continued up by 1.2% in May, .9% in June, and .6% in July. Unless there is a meltdown in the stock market in the next few days, August looks like it will print + as well.
The ongoing strength of the LEI's means that a prefect trifecta -- three out of three LEI measures linked with +GDP are positive *NOW*. Per Paul Krugman, we may have entered purgatory, but the fact is we are out of hell. While it is certainly possible that speculators could foolishly drive the price of Oil over $100 again, and trigger another recession next year, the simple fact is, this Recession is over.
First, in the past, +LEI readings for 3 months in a row has typically meant the start of +GDP. Here is a graph, showing that since WW2, every time there has been a significant (~2%) turn up in the 3 month average of the LEI, a recovery (in the sense of +GDP growth) has started immediately. We got the third positive monthly reading in June. Since March, the index has increased from 97.9 to 101.6, well in excess of 2%.
Second, when the year over year reading of LEI is positive, that typically means the +GDP has begun. In July 2008 the LEI stood at 101.2 (2004=100). As of June 2009, the LEI stood at 101.0 (after a +0.1% revision). July's 0.6% increase puts the index at 101.6, which triggers the second signal. Here it is graphically:
Third, when 9 of the 10 indicators have been positive for 6 months, it has always signaled +GDP:
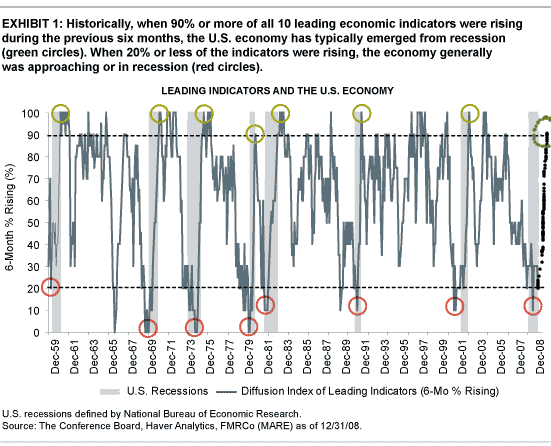
As of yesterday's +4.9% increase in durable goods orders, 9 of the 10 indicators now meet the criteria. Only new orders for nondurable consumer goods has not turned positve yet. All 9 of the others -- money supply, manufacturing hours, the bond yield curve, stock market, consumer sentiment, ISM manufacturing purchasing managers index, new orders for durable goods, and first time unemployment claims -- all of them are now positive over the last 6 months.
I'll spare you the bullish charts of stocks, bonds, and money supply, but here are the rest:
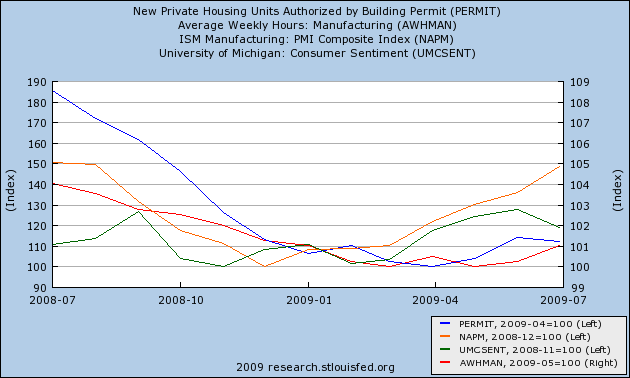
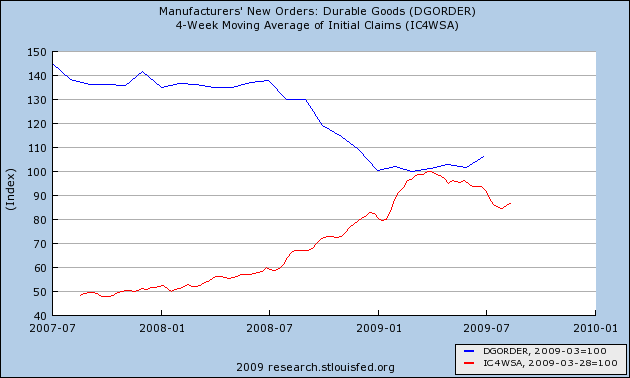
Note that housing permits, the purchasing managers index, and consumer sentiment are all up over 10% from their bottom reading (left scale). Average manufacturing hours (red) is shown on the right scale. Meanwhile, initial claims for jobless benefits have decreased close to 15% while manufacturers new orders for durable goods, after trending sideways, turned strongly positive in July (the most positive monthly reading since the beginning of the recession):
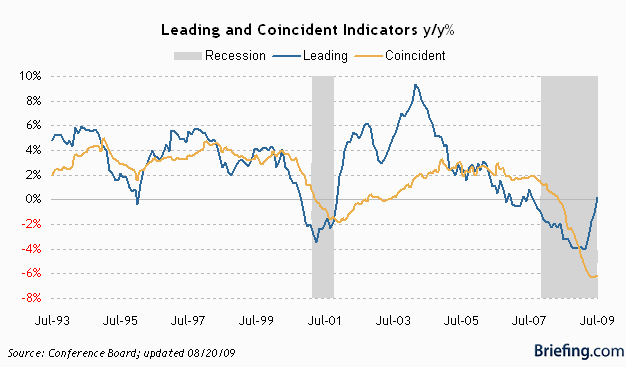
This is an enormously positive development, which as suggested by the coincident index (in yellow in the graph second from the top above), is beginning to show up in the coincident statistics, on which more below.
II.
Some people have said that we shouldn't rely on the LEI's, because this recession is different than post WW2 recessions. Unlike postwar recessions, all of the recessions during the Roaring Twenties and the Great Depression featured deflation. With the exception of the 1937-38 recession, no safety nets were in place. But we do have data from that era, and that data supports our conclusion as well.
First,wholesale and consumer price data has been collected for almost 100 years. The graph below shows consumer prices in blue, and wholesale prices in red, during the 1920s and 1930s. Notice that the cycle was a collapse in wholesale prices accompanied by deflation in consumer prices. At the moment that the economy was on the cusp of expansion, there was already increased demand for commodities, so wholesale prices started to firm; and the increased consumer demand meant that CPI started to firm on a year over year basis:
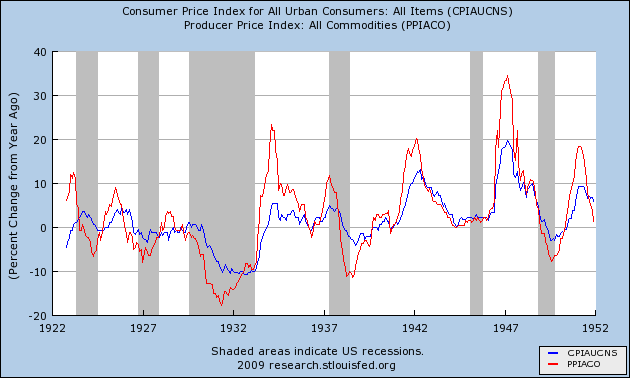
A similar dynamic is taking place right now:
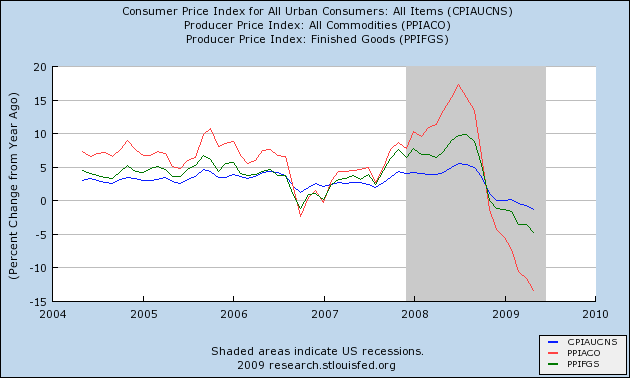
Notice how last year both wholesale and retail prices pitched headlong into deflation. Currently, YoY CPI is running -2.1%. Because late last year featured readings of -1.0% a month or similar due to the collapse in oil prices, the YoY PPI and CPI are almost certainly at their bottom right now, and will increase starting next month. That will indicate increased demand, and tin turn GDP growth.
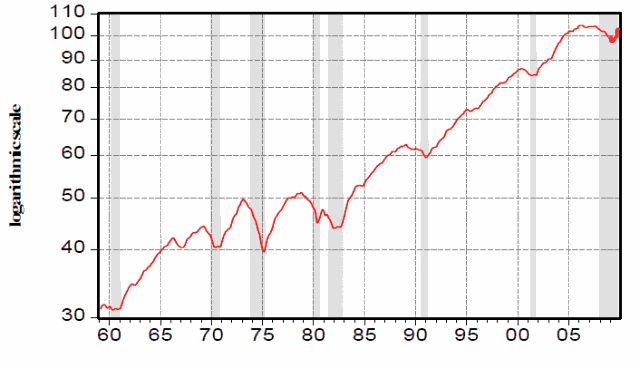
Second, there was a similar housing bubble in the 1920s. In fact, accounting for the difference in population, it was actually worse than the one earlier this decade. Housing starts declined for several years before 1929, and collapsed thereafter, bottoming in 1933 before recovering. Here's the graph (from a 1954 text) showing that process (the raw data can be found here).

Per Calculated Risk, "housing led the way out of the Great Depression." Unfortunately, housing data was only connected yearly then. Now we have monthly data, but two former noted housing bears, the aforesaid Calculated Risk and Tim Iacono of "The Mess that Greenspan Made" now believe that more likely than not, the bottom for housing starts took place in January of 2009. If any further proof was needed, yesterday's blowout good number for new home sales -- which also showed that inventory decreased to a more normal 7 months from its high of about 1 year --
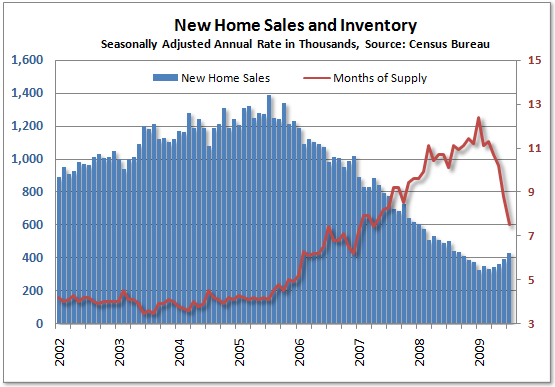
put an exclamation point to the data.
III.
Three months after our initial call, not only are the LEI's continuing to support our position, but now 2 of the 5 coincident indicators that members of the NBER use to date recessions are also up from their bottom, and a third stopped declining last month. Specifically,
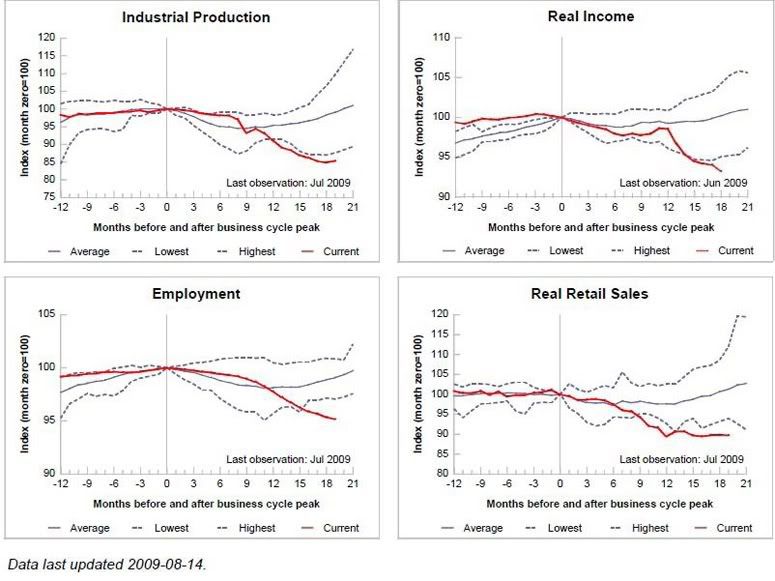
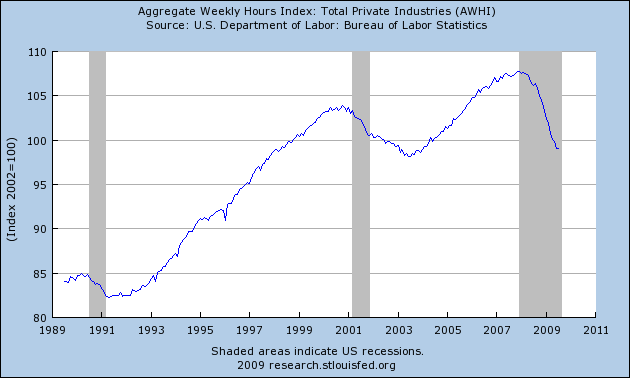
real retail sales may have hit bottom in December 2008, and after plummeting for months, industrial production surprisingly turned up 0.4% last month. Personal income is still declining badly, and employment is also still declining, although less so than earlier this year. But here is the graph of total hours of private employment (that has also been flagged by a member of the NBER as important to him in dating recessions), which stopped declining last month, just as it did at the end of the 1990 and 2001 recessions (In previous recessions, this indicator declined into the end of the recession, and then reversed course on a dime):
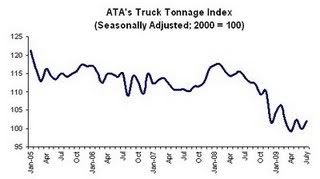
Other coincident data is stabilizing or trending positive as well. The July trucking index just came out, reversing the June loss. On a smoothed basis, that index is now flat.
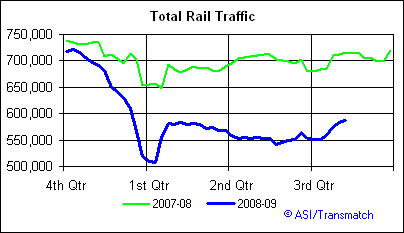
The railroad car index has trended firmly upward for over a month now as well, after having moved generally sideways previously in the year.
And of course, let's not forget auto sales:
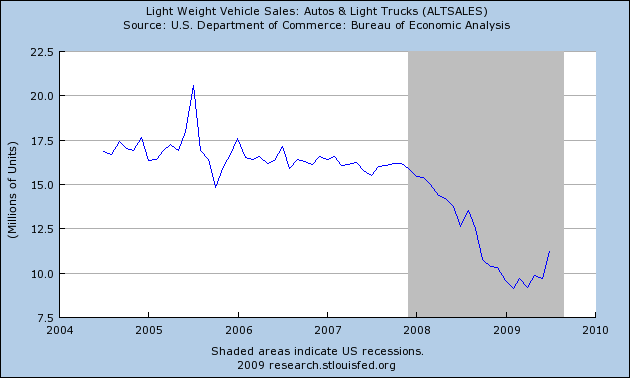
For those wondering what the source of growth in a recovery will be, the answer taking shape is: durable goods like housing and autos, manufacturing in general, and exports to increasingly prosperous Asian consumers.
Conclusion
Reporting economic data like "leading economic indicators" is a cold business, that doesn't capture the day to day struggles of those living through hard times. This truth was recently described passionately by a housing activist who deals with a lot of really poor and struggling folk. She described how even if the economy turns around, a lot of people -- maybe even a majority of people -- are still in a world of hurt. She sees a division between ever fewer haves and ever more have-nots as the outcome even of an economic recovery.
Her point is both vital and correct. It is essential that the current democratic Congress and White House show by words and deeds that they are taking the plight of the people at the bottom of the economic ladder. with the real sense of urgency it deserves. It is also essential, now as the economy turns positive, that real reforms be enacted to ensure that the benefits of American productivity are shared by all its people, not just those few at the very top. A commentator called what Washington has done in the last year "an extreme series of New Deal for Wall Street programs" which captures insiders' priorities perfectly. The need for a jobs policy in this country to fix the chasm whereby we get "jobless recoveries" that require 2% GDP growth on an ongoing basis before a single net new American job is created (a point has now been embraced by Paul Krugman as well) is now directly in the spotlight. Real, long term structural reform of the economy beyond health care is critical and ought to be a highest priority.
In the meantime, the simple truth is, in the three months since Bonddad and I posted our joint diary, our case that a return to +GDP is close was strengthened by nearly all of the data, and at long last it is time to state the simple truth: Bonddad and I were right. This Recession is over.
From Bonddad: I'm in complete agreement with NDD on this one. I would add that initial unemployment claims are trending down, the New York and Philly Fed numbers are still increasing, existing home sales have stabilized, durable goods orders have bottomed on a year over year basis and showed s solid jump last month, the credit markets have clearly settled down and are back to pre-crisis levels, and commodities' are increasing indicating an expected increase in demand.
I would also add this: NDD makes a solid point about how these numbers are cold and rather inhuman sounding. I wish there was a way to personalize this information more. But, that is infortunatly the nature of the business.