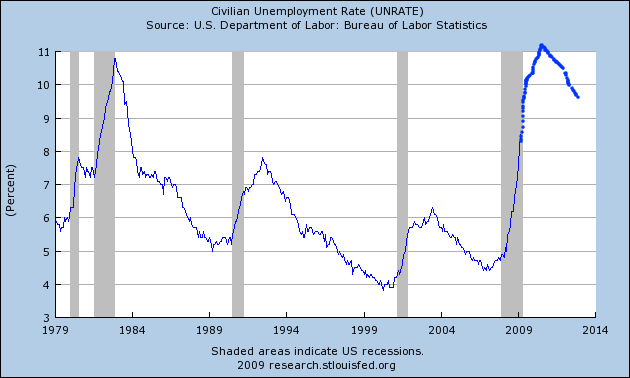
This post originally began as an examination of whether trends in the leading indicator of new jobless claims could give us useful information to predict when the number of unemployed will peak -- and then took several totally unexpected turns.
Ultimately what I discovered -- and I'm not saying it will happen, only that there is a surprisingly decent case to be made that it might -- is that contrary to the accepted wisdom, the recovery from this recession may not be "jobless" at all, but particularly in its earlier portion may feature quite robust job growth. There are three separate metrics supporting such an outcome: (1) "jobless" recoveries have only happened when manufacturing hours have not slipped significantly below full time employment; (2) the steeper the inventory correction, the more robust the snap-back; and (3) pent-up consumer demand can support a very robust snap-back recovery.
Let's take the arguments in order:
I. Offshoring and Recovery: Slack manufacturing employment has in the past snapped back quickly
In the course of researching the relationship between declines in initial jobless claims and peaks in unemployment, I found that (1) in those recessions and recoveries where jobless claims fell steeply, peak unemployment occurred within 2 months of the point where jobless claims fell 12% from the peak; but (2) in those recessions and recoveries where jobless claims fell slowly, peak unemployment occurred not at the 12% mark, but only when new jobless claims were more than 16% less than peak claims, and stayed more than 16% off for at least 3 months thereafter. What was totally unexpected, was that in both the 1991 and 2001 recessions, as soon as the 16% marker was reached, the recovery in jobs stalled. Something was happening that was interfering with the hiring of more workers exactly at the point where new hiring, and plant expansion, should have kicked in. I suspected, and still do, that what was really happening was that once the economy began to pick up -- and only then -- employers took advantage of the situation not to hire more Americans, but instead to offshore jobs and plants to low wage countries.
Here's the chart, showing the year, and months from the peak in initial jobless claims that they retreated 12%, 16%, and the month of peak unemployment. In the case of the two "jobless recoveries" I also show the range from peak of initial jobless claims during the time of +GDP with increasing unemployment:
| Year | Mo./-12% | Mo./-16% | Mo./peak unemployment | range/ jobless claims |
|---|---|---|---|---|
| 1970-71 | 1/71 | 2/71 | 11/70 | n/a |
| 1974-75 | 5/75 | 7/75 | 5/75 | n/a |
| 1980 | 7/80 | 8/80 | 7/80 | n/a |
| 1982 | 10/82 | 11/82 | 12/82 | n/a |
| 1991-92 | 9/91 | 7/91, 6/92 | 6/92 | -8% to -16% |
| 2001-03 | 12/01 | 2/02, 6/03 | 6/03 | -7% to -21% |
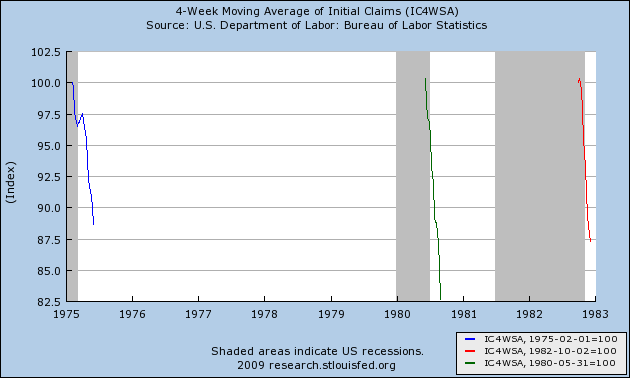
For those who prefer visual aids, here is the graph showing the quick falloff in jobless claims until unemployment peaked in the 1974, 1980, and 1982 recessions:
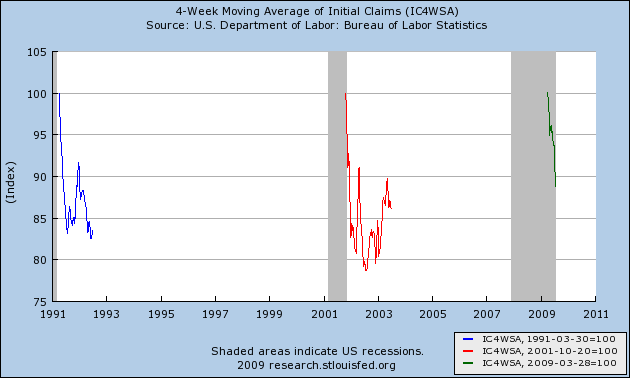
and the second one showing the very long "jobless recoveries" just as the falloff hit the 16% mark at the end of the 1991 and 2001 recession, as well as the most recent data from the April 2009 high in initial jobless claims:
Since there is no "smoking gun" of data from manufacturers' advertising their intent to offshore jobs, I looked at one place where it might show up -- in the statistic for average weekly hours in manufacturing. In other words, rather than increase hours, employees' hours worked would be flat, as offshoring occurred instead of rehiring and expansion. What I found was more complex. Here's a graph of manufacturing hours since 1949:
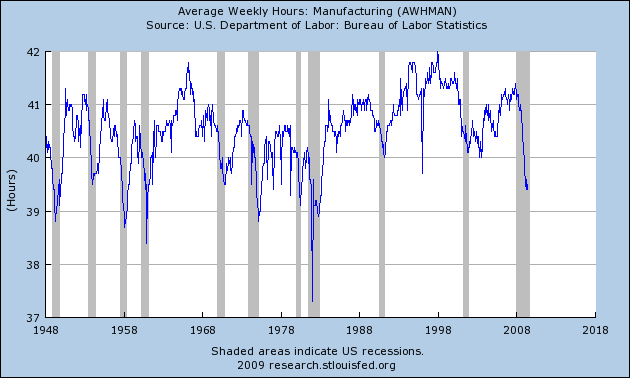
In general, over that entire time period, the deeper the "V" in hours (i.e., more than a 1.5 hour decline, to a level below 39.5 hours), the quicker the snap-back in hours worked once the recession ended. (The one ambiguous case is the tepid hours recovery from the 1970 recession, during which time not only were the mass of baby boomers for the first time entering the full-time job market, but 500,000 of them were being withdrawn from Vietnam for an extra surge of workers.) In the above graph, the 1991 and 2001 recessions stand out like a sore thumb: In neither case did hours worked ever fall below 40! Once the recession ended, there was no slack to be picked up by rehiring laid off workers and increasing production at the plant. Instead, the offshoring (I hypothesize) began immediately.
Let's return to jobless claims and our current recession. Right now, 3 1/2 months after peak initial jobless claims, we are just at 12% off from the peak. Should our present rate of decline be sustained after the midsummer anomalies -- not a sure thing of course -- we will cross the 16% mark (~550,000 new claims per week) in one more more month. If we are to have a "jobless recovery", the number should quickly (with a couple of months) stall there and increase again. If, on the other hand, we will have a "V" shaped recovery, the marked decline in new unemployment claims should continue. If past patterns are prologue, then what the graph of average hours worked in manufacturing argues is that at least over a substantial period thereafter, we will have a quick snap-back in hiring as opposed to a "jobless recovery."
In addition to the pattern of recoveries from past sharp manufacturing employment slumps, there are two other reasons why a "V" shaped jobs recovery might occur.
II. Rapid inventory reduction can give rise to a rapid snap-back. Dr. James Hamilton has laid out this aspect of the case for a V Shaped Recovery. I encourage you to read the entire article, but it can be summarized as follows:
"[O]ften a sharp economic downturn is followed by an equally sharp economic recovery. One reason for that is the liquidation of inventories that accompanies any recession and restocking that takes place in recovery.
"The typical pattern is for inventory investment to fall well below trend during an economic downturn. ...[S]ince the current recession began in 2007:Q4 ... the level of inventories is lower than you would have expected in the absence of a recession by about ... 0.91% of one year's GDP. Add that restocking to the normal [ ] inventory investment that we'd expect ..., and you get a possible contribution of inventory investment of ... 1.12% of GDP during the first year of the recovery.
"If we are looking at the growth rate of real GDP, which is how we usually think about these numbers, the potential contribution of inventory investment is even more dramatic. If inventory investment goes from subtracting 0.49% from GDP (as it did over the last 4 quarters) to adding 1.12% to GDP ..., the contribution to the growth rate of real GDP would be 1.12 - -0.49 = 1.61%."
In layperson's terms, "just-in-time" inventory systems will jump start any recovery just as they accelerated the 2008 downturn. Interestingly, Dr. Hamilton supplies a chart indicating that inventory replenishing was significantly higher during the recoveries after 1974, 1980, and 1982, than it was for those after 1970, 1991, and 2001 -- in other words, correlating exactly with the graphic support from average manufacturing hours during and post recessions I laid out above in Part I.
III. This leads us to the third and final argument in favor of a "V" shaped jobs recovery: pent-up consumer demand, especially for durable goods.
In the same article above, Dr. Hamilton further notes that
"similar dynamics also apply to a number of other components of GDP. For example, recent sales levels for motor vehicle appear to be significantly below normal scrappage rates, and this is another area where a big rebound effect is quite possible."Similarly, Calculated Risk has noted that the
"turnover ratio for the U.S. fleet [of cars] ... for January [2009] is 27 years, by far the highest ever. The actual in December was close to 24 years. This is an unsustainable level...."
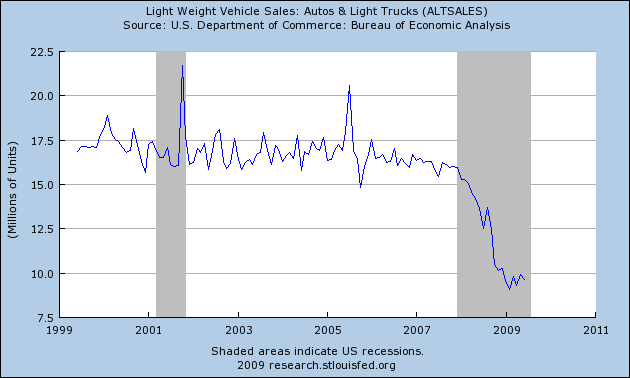
Here is the graph of auto sales for the last 10 years:
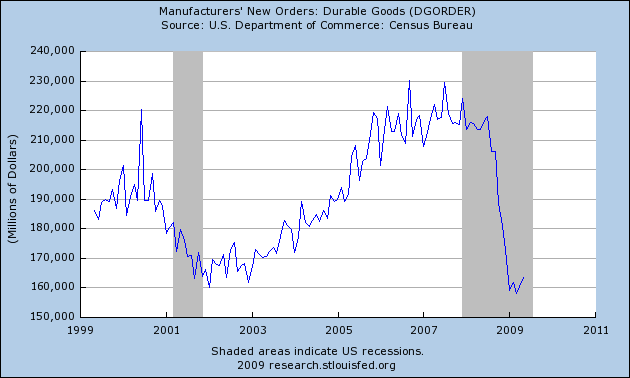
And here is the same graph for durable goods produced:
And finally for real retail sales:
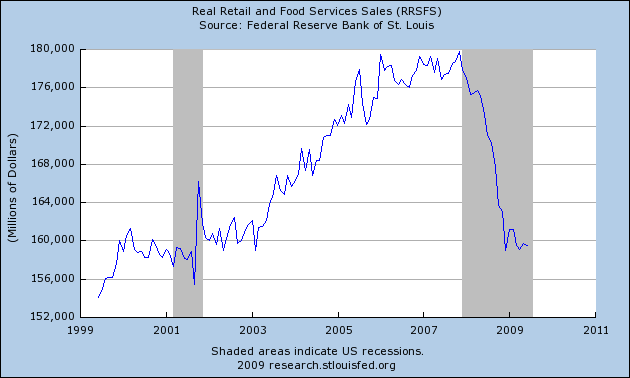
You can see that auto sales have fallen from 16m to 9m, or roughly 40%. Durable goods have fallen off 30%. Retail sales in general fell over 10% in the last year. Compare that with the complete non-event of the 2001 recession.
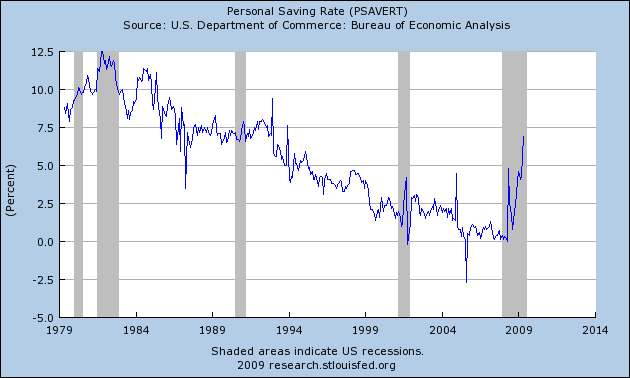
Yet, despite the steep fall in all kinds of sales, as late as April 2008, the unemployment rate was only 5%. Even with a 10% unemployment rate, that means that American consumers have roughly 94%-95% of the purchasing power from their income that they had a year ago. We know where the missing 5% has gone -- into savings, as shown by the personal savings graph below:
I pointed out in my essay, "Black September", how much of the free-fall of late last year was due to the complete destruction of confidence accomplished by Paulson, Bernanke, Bush and Congress last September, when Americans were warned that the economic world faced Armageddon in only a matter of days. What happened then was typified by this quote from a prominent auto dealer:
on about September 10, we saw our business fall off 30-35%.
As Calculated Risk said at the time, after one particularly panicky speech by George Bush,
it might motivate people that haven't been paying attention to say: "Wow, this is bad. Let's make sure our money is safe, and watch our expenditures." And that could lead to a deeper recession."And indeed American families abruptly and severely cut spending.
As a result, while Americans as a whole only lost 5%-6% of their income, but car sales did not go down 6% -- they went down 40%! In short, fearful of losing their jobs, and fearful of the future, Americans panicked and started to save, much more in the aggregate than the immediate risks called for (because no individual or family knew if they were going to be among the ones thrown out of jobs or not). Once that fear passes -- once Americans feel confident that the economy is growing instead of contracting -- there is a 5% boost to consumer spending that is immediately available (I'm not advocating for a 0% savings rate, merely pointing out that some of that savings can in fact be released). There is no necessary reason that such a boost cannot happen very quickly. In other words, a mirror image increase in demand to the "Black September" plunge of last year cannot be ruled out.
Compare again with the 2001 recession. Consumers sailed through that recession, so there was no snap-back of increased consumer spending once it ended.
If auto sales, durable goods sales, and general retail sales begin to pick up quickly, the above discussion of manufacturing hours suggests that, unlike the jobless recoveries of 1991 and 2001, there could be a very robust rehiring of workers in the residential, auto, and other durable goods producing industries, at least until such point as plants are operating at full capacity.
Putting the three points above together, and to summarize, if there is a relatively rapid uptick in consumer demand, that coincides with relatively depleted inventories of durables and consumer goods, and factories have cut employees to the bone, then employees in all sorts of industries might be hired back quickly, causing a "V" shaped Jobs Recovery.
How will we know if a "V" shaped jobs recovery is occurring? First, I would want to see Year over Year Leading Economic Indicators turn positive. Barring another sudden downdraft, this is likely to happen no later than September. Once that happens then I suggest that 4 series -- all of which have the virtue of being released within a week after the end of the month on which they report -- will tell us pretty quickly whether we are having a "V" shaped or "jobless" recovery:
- (1) monthly nonfarm payrolls: a gain of under 50,000 a month means a jobless recovery, gains over 100,000 within 3 months support a more "V" shaped recovery.
- (2) monthly auto sales: annual sales rising less than 125,000 a month means lackluster consumer durables spending, over 200,000 supports a "V" shaped recovery.
- (3) monthly manufacturing hours worked: an average rise of only 0.1 hours per month means a lackluster increase in plant use, over 0.15 supports a "V" shaped recovery.
- (4) the ISM manufacturing index: a quick expansion of manufacturing should be supported by the index rising to at least 60.
I still believe the government should move to create a new WPA. Additionally, so long as wage growth remains weak, any recovery will not be robust in the longer term. Let me repeat that I am not saying that we will have a "V"-shaped jobs recovery -- only that a surprisingly substantial case can be made in favor of one If so, I have set forth a road map in this essay to test whether fortune might favor us.