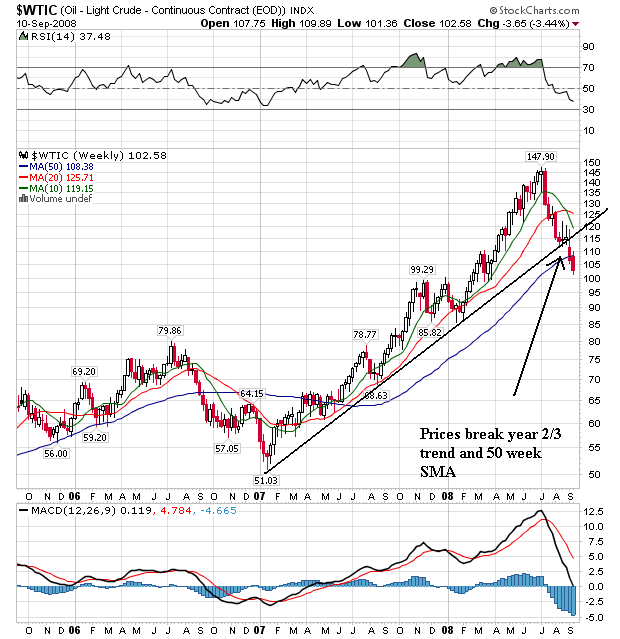
Prices continue moving lower. Note the following:
-- Prices broke the trend line that started a year and a half ago.
-- Prices moved through the 50 week SMA
-- The 10 week SMA moved below the 20 week SMA
-- The 20 week SMA is turning negative
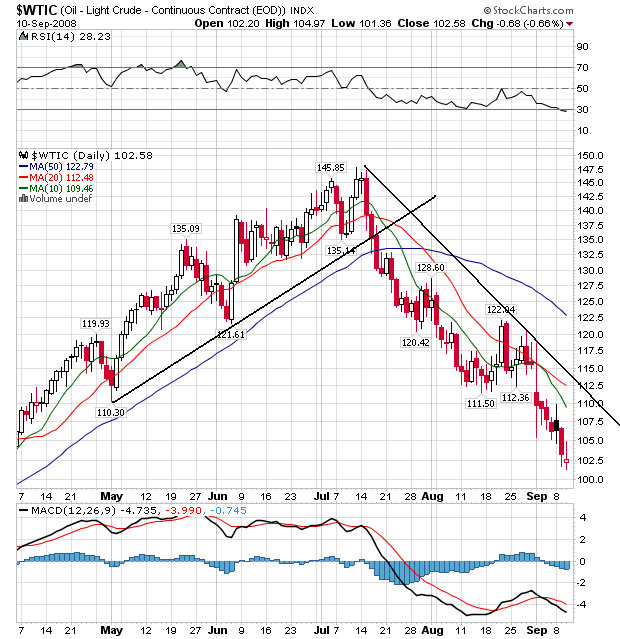
On the daily chart, note the following:
-- All the SMAs are moving lower
-- The shorter SMAs are below the longer SMAs
-- Prices are below all the SMAs
-- Prices have been moving lower for about two months
This is a bearish chart, and the weekly chart is bearish as well. The oil market is currently in the middle of a large sell-off.