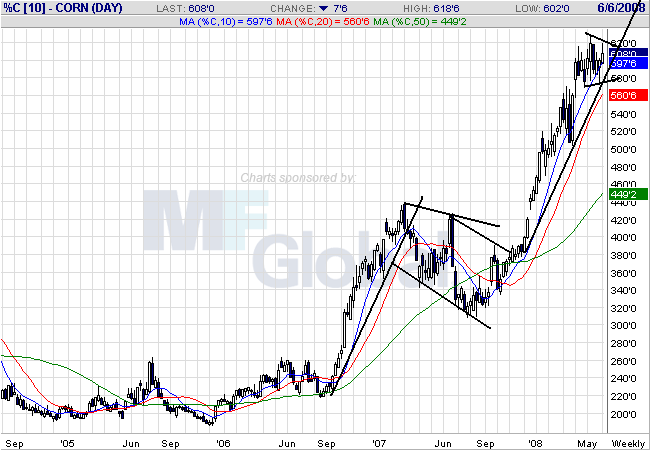
On the weekly corn chart, notice the clear rally/consolidate/rally pattern that has emerged over the last year and a half. Also notice that prices are currently consolidating at high levels.
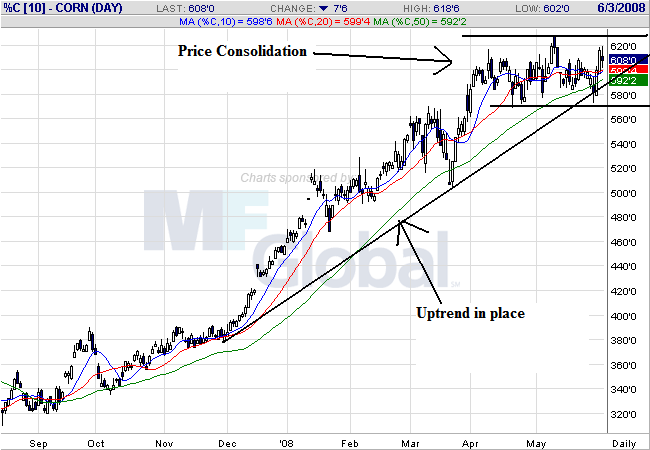
On the daily chart, notice that prices are still in an uptrend, but they are clearly in a trading range for the last two months. On the SMA front, notice the following:
-- Prices are bunched up with the 10, 20 and 50 day SMA, indicating a great deal of indecision.
-- The 10 and 20 day SMA are both horizontal right now.
-- The SMAs are in a very tight range, indicating more indecision.
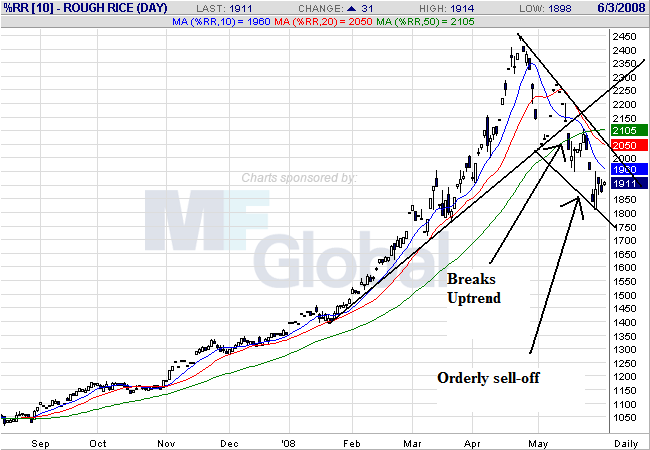
On the rice chart, notice that prices have now broken through support of a trend line that started at the end of January. Also notice the following:
-- The 10 and 20 day SMAs are both moving lower
-- The 10 and 20 day SMA have both moved through the 50 day SMA
-- Prices are below all the moving averages, which will keep pulling the SMAs lower.
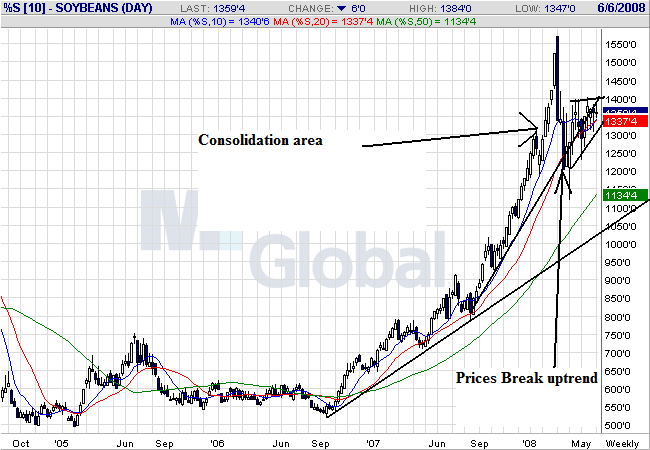
On soy beans weekly chart, notice that prices broke the uptrend that started at the end of September, but are still in a longer-term trend that started at the end of September 2007. Also notice that prices are currently consolidating in a triangle pattern.
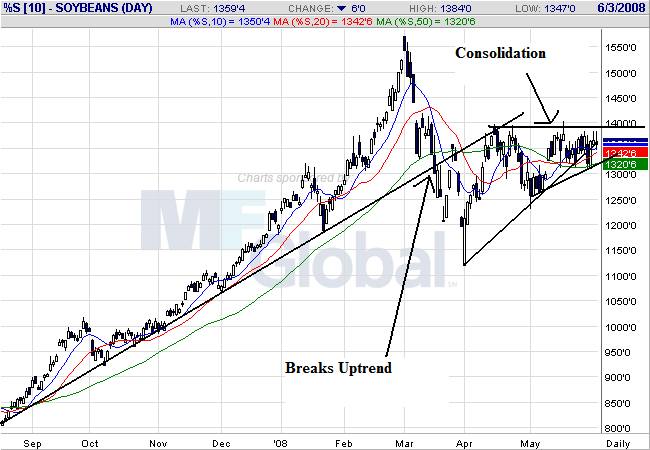
On soy beans daily chart, we can see the trend break far more clearly. Also notice that prices and the SMAs are tied up in a very tight range, with all the SMAs essentially giving a very neutral read.
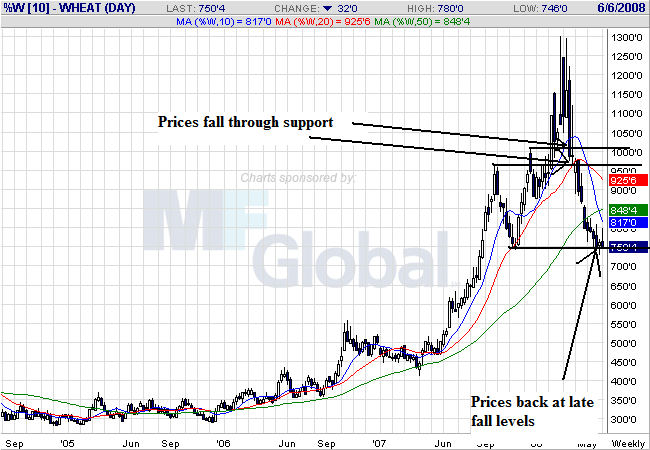
On wheat's weekly chart, notice that prices have come down to late fall 2007 levels.
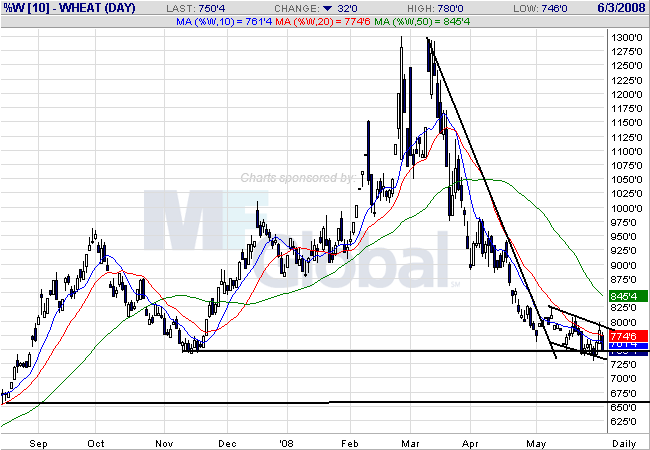
On the daily chart, notice the following:
-- The 10, 20 and 50 day SMA are all moving lower
-- The shorter SMAs are below the longer SMAs
-- Prices are running into upside resistance with the SMAs, implying prices are moving lower.
With the exception of corn (which has a huge boost from ethanol) all other agricultural commodities are coming down in price right now. That's good news for inflation.