All the charts have the exact same patter. A strong pop at the opening, followed by consolidation until the last hour or so of trading. The only exception was the Russell 2000, which showed a bit more life mid-session.
Looking at the daily charts we see the following:
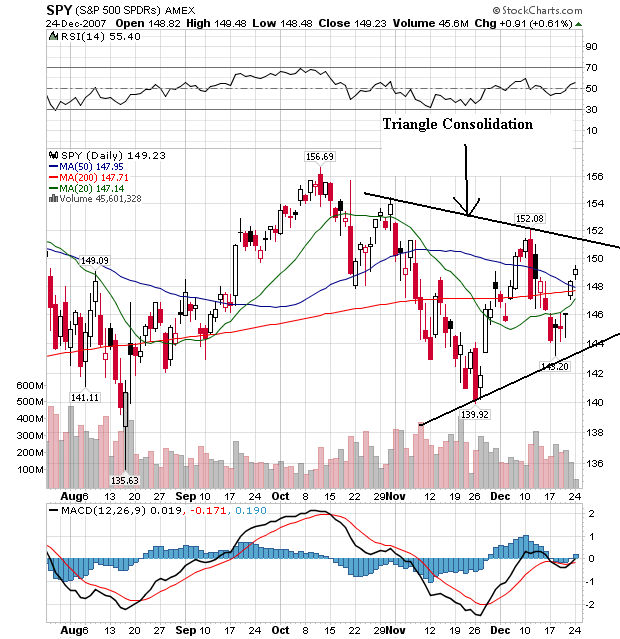
The SPYs are in the middle of a triangle consolidation pattern.
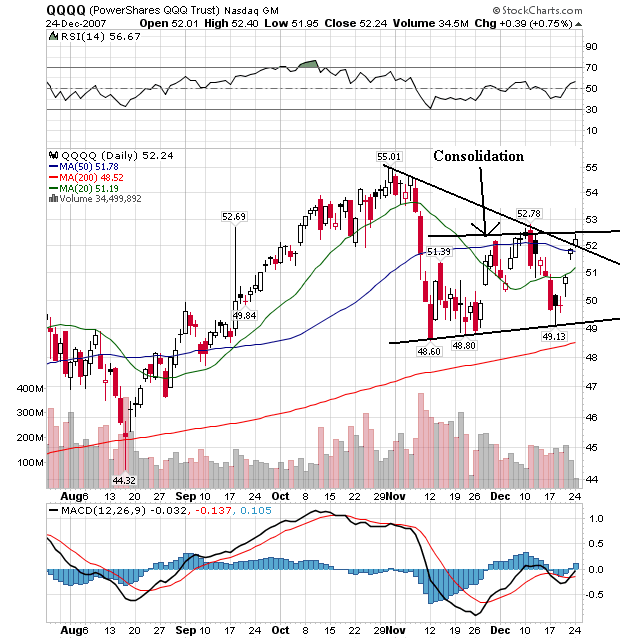
The QQQQs are also consolidating, but are doing so in a rectangle pattern. However, they have broken their short-term downtrend.
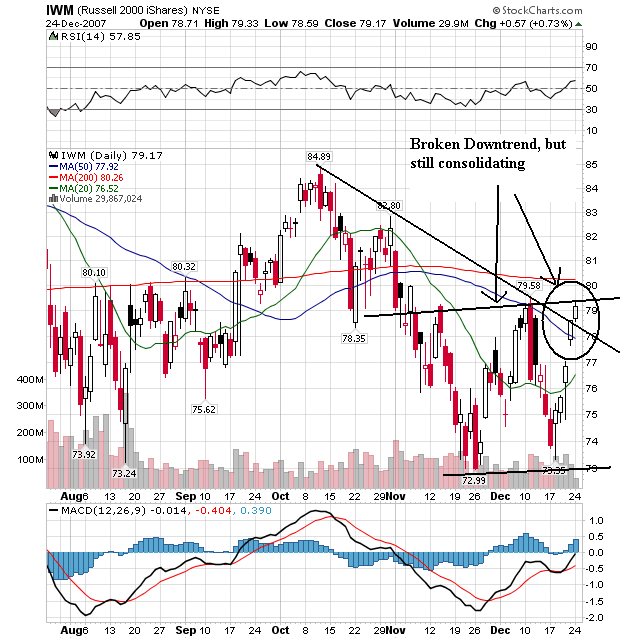
The Russell 200) (IWMs) have broken through their downtrend but are also consolidating.
I have no idea what to expect over the next few weeks. The moving averages are bunched up big time, indicating the market is also looking for direction.